What Albert Calls a Break of Structure
Albert’s strategy is built around Break of Structure (BOS). Simply put, it is the moment when price breaks the current market structure, potentially signaling a change in direction.
“It’s when price breaks the previous high of a downtrend. If price breaks it and holds above it, the trend is broken and we can start looking for long positions.”
But a breakout alone isn’t enough for Albert to enter a trade.
He only looks for clear structures where local highs and lows are easy to identify. If price action is messy and the market has been moving in a loose sideways range for a long time, he prefers to skip the signal.
“Here, it’s not clear at all where the highs and lows are. You can identify them, but they’re very unclear. Here, though, we have two highs with a clear low between them, so the picture is much clearer.”
In other words, what matters to Albert isn’t simply whether a breakout occurs, but how clearly the structure was defined beforehand. The clearer the highs and lows, the easier it is to identify the level after which the structure can be considered broken.
He usually places his Stop Loss below the most recent local low or behind the impulse candle. The second option allows him to reduce the Stop Loss distance and achieve a better risk-to-reward ratio.
Albert’s Custom Indicator: How He Finds Trade Zones
Albert has automated part of his analysis with a custom indicator.
It is based on moving averages whose parameters have been optimized using ATR across several thousand bars of historical data.
The indicator’s main purpose is not to provide a ready-made entry signal, but to highlight zones where price could potentially reverse.
However, Albert doesn’t use the indicator in all market conditions. After strong impulsive moves, its zones become less accurate because moving averages need time to adapt to the new price level.
“You need to wait for the market to calm down before using the indicator again. Moving averages lag – they can’t keep up with a sharp move, so they need time to adjust.”
That’s why, after a sharp pump, Albert prefers to wait for the market to stabilize before using the indicator zones again.
The strategy itself, however, does not depend on the indicator. A Break of Structure can also be identified through liquidity.
Albert marks the highest-volume level on the Volume Profile, waits for price to reach that zone and sweep liquidity, and then looks for confirmation in the form of a Break of Structure.
So the indicator helps him find potentially interesting zones faster, but Albert makes the actual entry decision based on price action.
How to Tell a Real Break from a False One
A breakout of a level does not automatically mean that the market structure has actually changed.
For Albert, it is important that price not only moves beyond a significant level but also manages to hold beyond it.
If price breaks the level but quickly moves back, he considers it a false break.
“There was a very small break here. Price reached this level and then bounced back below it. There’s already a small bearish break here, so this can be considered a false break.”
That’s why Albert doesn’t rush into a trade immediately after a breakout.
First, he watches how price reacts. Only after receiving confirmation does he decide whether the market structure has actually changed.
How Albert Trades Break of Structure in Different Market Phases
Albert doesn’t use Break of Structure only in sideways markets. In his experience, the approach can also be applied during a strong trend, although the signal needs to be identified differently.
“When there’s a strong trend, the Break of Structure can be small. Price breaks the structure, makes a slight correction, and then continues moving. The important thing here is to look for breaks on a lower timeframe.”
For example, during an uptrend, Albert looks for smaller Breaks of Structure during corrections so he can trade in the direction of the main move.
If the market moves into a sideways range after a strong rally, the logic changes. He then focuses on the boundaries of the established range and looks for breaks within it, trading moves from one boundary to the other.
“Overall, Break of Structure is a very versatile strategy. You can use it in different market phases.”
The strategy itself remains the same, but Albert adapts the way he looks for entries to the current market phase.
Why Albert Looks for Shorts Even When He Expects the Market to Keep Rising
At first glance, this may seem contradictory: Albert expects the bull market to continue in the long term, yet he is currently considering short positions.
The reason is that he separates the market’s broader direction from its current price structure.
“For me, we’re still in a bear market. On the weekly timeframe, we haven’t made a new high or held above it, meaning that the actual trend break hasn’t happened yet. We reached that level and will most likely move lower unless, of course, we break through it.”
Until there is a confirmed Break of Structure on the weekly chart, Albert does not consider the local bearish move to be over. That’s why he is still willing to look for shorts even though he expects the market to rise over the longer term.
However, to take a trade against the broader trend, he needs stronger confirmation – at minimum, a Break of Structure on the 4-hour timeframe.
Albert may also look at the 0.5 Fibonacci retracement level, where, based on his observations, price often returns after a strong impulse.
For trading, he mainly chooses large crypto assets: Bitcoin, Ethereum, HYPE, and LDO.
According to Albert, their price action fits his system better. He also pays close attention to large liquidations: after these events, market structure often becomes more pronounced, making setups easier to identify.
His list of assets isn’t fixed. Albert keeps a trading journal and tracks how well his strategy performs on each coin. Recently, for example, he has been gradually moving away from HYPE because its strong upward movement has been producing too many false breaks for his system.
Albert doesn’t change the strategy itself. Instead, he adapts the conditions in which he applies it: trade direction, timeframe, and asset are selected based on the current market structure.
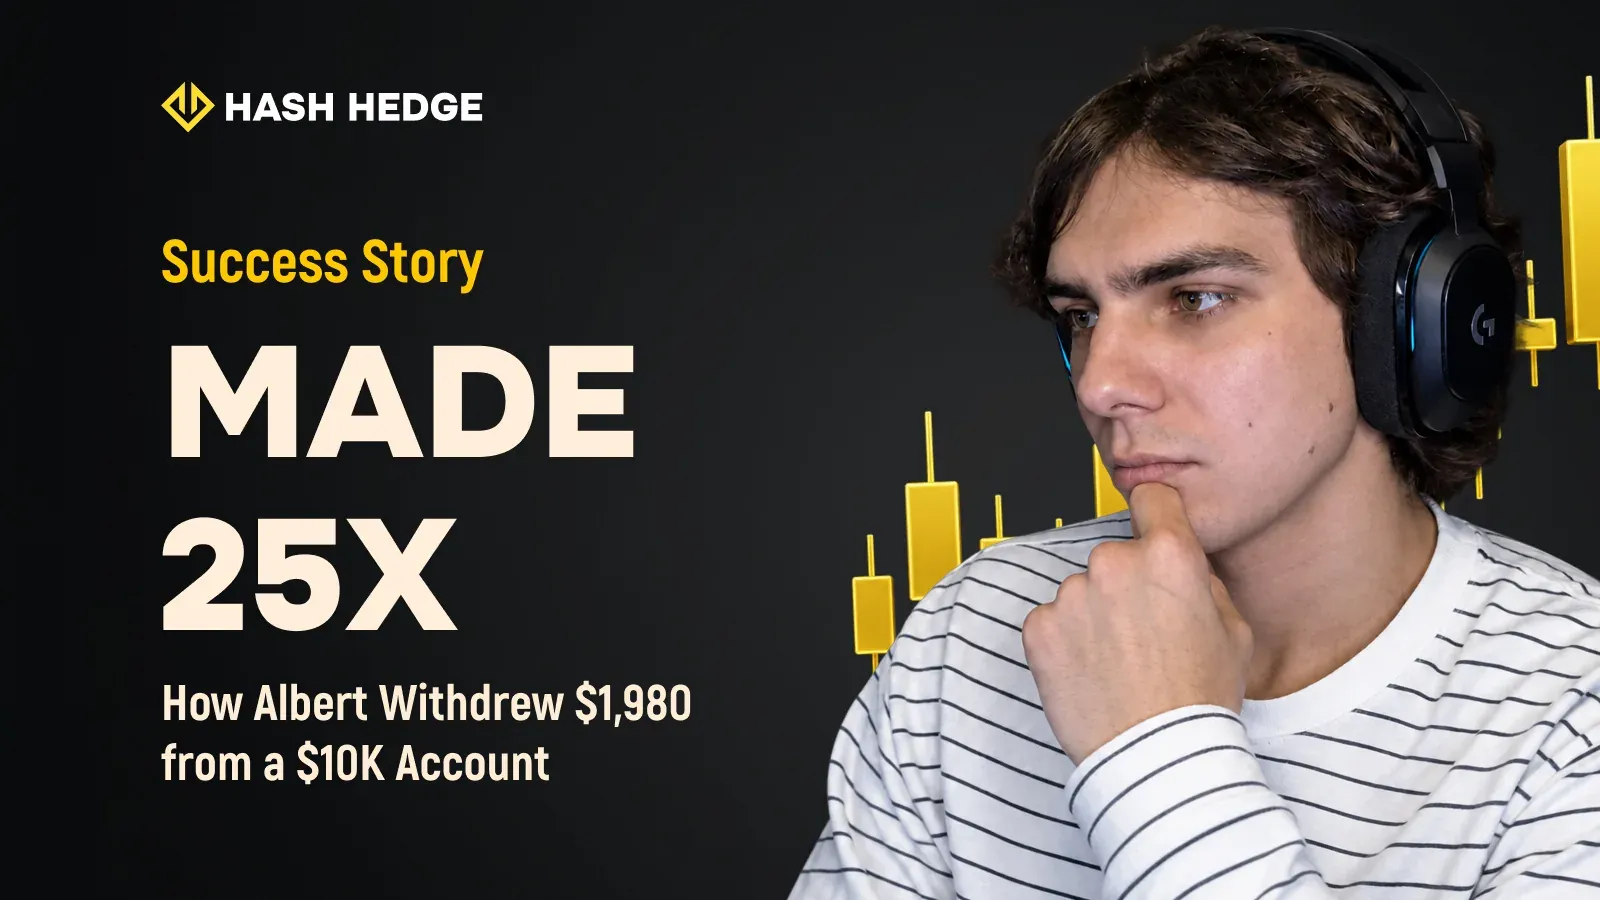
A $79 Challenge and Four Payouts Totaling $1,980
Albert entered prop trading because he had limited personal capital.
Instead of spending years trying to gradually build up his own trading balance, he decided to scale through prop trading. That’s how he bought a $10,000 Hash Hedge Challenge for $79.
“I think that if you trade strictly according to your risk management and system, you can pass a Challenge with a 100% probability. That’s what happened for me, and I was also lucky with the market phase – it was almost perfect for my trading system.”
After passing the Challenge, Albert received 4 payouts from the same Funded Account totaling $1,980:
- $327.76
- $325.30
- $774.70
- $552.55




30-60 Minutes a Day for All His Trading
Despite receiving four payouts from the same Funded Account, Albert doesn’t spend his entire day staring at charts. He usually spends just 30–60 minutes a day analyzing the market and looking for trades.
“If there are no trades, it takes about half an hour. I check the charts throughout the day. If price hasn’t reached a buy or sell zone or there’s no Break of Structure, I don’t enter a trade.”
Albert checks the charts around three times a day: in the morning over breakfast, during the day, and in the evening. He deliberately avoids opening the market before going to bed so that he doesn’t carry thoughts about trades into the night.
On average, he opens no more than one trade per day. If price doesn’t reach the right zone or a Break of Structure doesn’t form, Albert simply stays out of the market.
“Trading is a profession, and that’s exactly how I treat it – very seriously.”
Trading used to require much more of his time, energy, and emotion. As he gained experience, the process became simpler: he developed a clear algorithm and no longer felt the need to constantly monitor every price movement.
“I’ve already come quite a long way, so it’s a little easier for me now.”
For Albert, trading remains an additional source of income. He also works in currency exchange and plans to develop his own premium fragrance business. Because of this, he doesn’t need to chase trades or try to extract profit from the market every single day.
How to Keep a Funded Account After the First Payout
Getting the first payout is only part of the challenge.
For Albert, keeping the Funded Account and continuing to withdraw profits from it is more important. In his case, he managed to do this four times in a row.
He highlights two rules that helped him avoid losing the account between payouts.
RULE #1 – Take a Break After an Important Milestone
After passing a Challenge stage or receiving a Funded Account, Albert doesn’t try to jump straight back into active trading. First, he gives himself time to reset and adjust to the new stage.
“You need to give yourself some time to rest, realize that you’ve passed the stage, let it sink in, and only then move forward instead of immediately rushing back into the market.”
RULE #2 – Don’t Cling to a Strategy If the Market Has Changed
Albert has been trading Break of Structure for two years, but that doesn’t mean he applies it in exactly the same way under all market conditions.
If his usual setups start failing one after another, he first asks whether the market phase itself has changed.
“If the market has changed significantly, you shouldn’t keep blindly following your strategy, especially when one trade after another closes at a loss. It’s better to look at the situation from another angle. There was a point when, after a strong pump, I kept trading with the trend even though the market had already moved sideways. I had to switch to trading from the lower boundary to the upper boundary. You need to be flexible.”
For Albert, flexibility doesn’t mean constantly switching strategies. It means knowing how to adapt the way a strategy is applied to the current market structure.
Key Takeaways
1. Signal quality matters more than the number of trades
Albert enters only when the structure is clearly defined. If the highs and lows are unclear, he prefers to skip the move rather than force an entry.
2. Funded Account size should be increased gradually
Albert doesn’t want to jump straight from $10,000 to $100,000. His plan is to progress step by step:
$10,000 → $25,000 → $50,000 → $100,000
This allows him to gradually get used to larger amounts of capital and higher risk in absolute dollar terms.
3. Low risk alone won’t help without discipline
Albert failed his first Challenge at another prop firm even while risking only 0.4% per trade. The reason was his desire to speed up the result. On the next Challenge, he was able to control his emotions better and stick to his system.
4. You don’t need to spend all day staring at charts
Albert now needs only 30–60 minutes a day. If price doesn’t reach the right zone and there is no Break of Structure, he simply doesn’t open a trade.
5. A strategy needs to adapt to the market phase
When a trend turns into a sideways market, Albert doesn’t mechanically continue trading according to the old logic. The strategy remains the same, but the conditions for applying it change.
6. The first payout shouldn’t be a reason to increase risk
Albert takes a break after major milestones and only then returns to trading. This approach helped him keep the same Funded Account and receive four consecutive payouts totaling $1,980.