Mean Reversion in Plain English
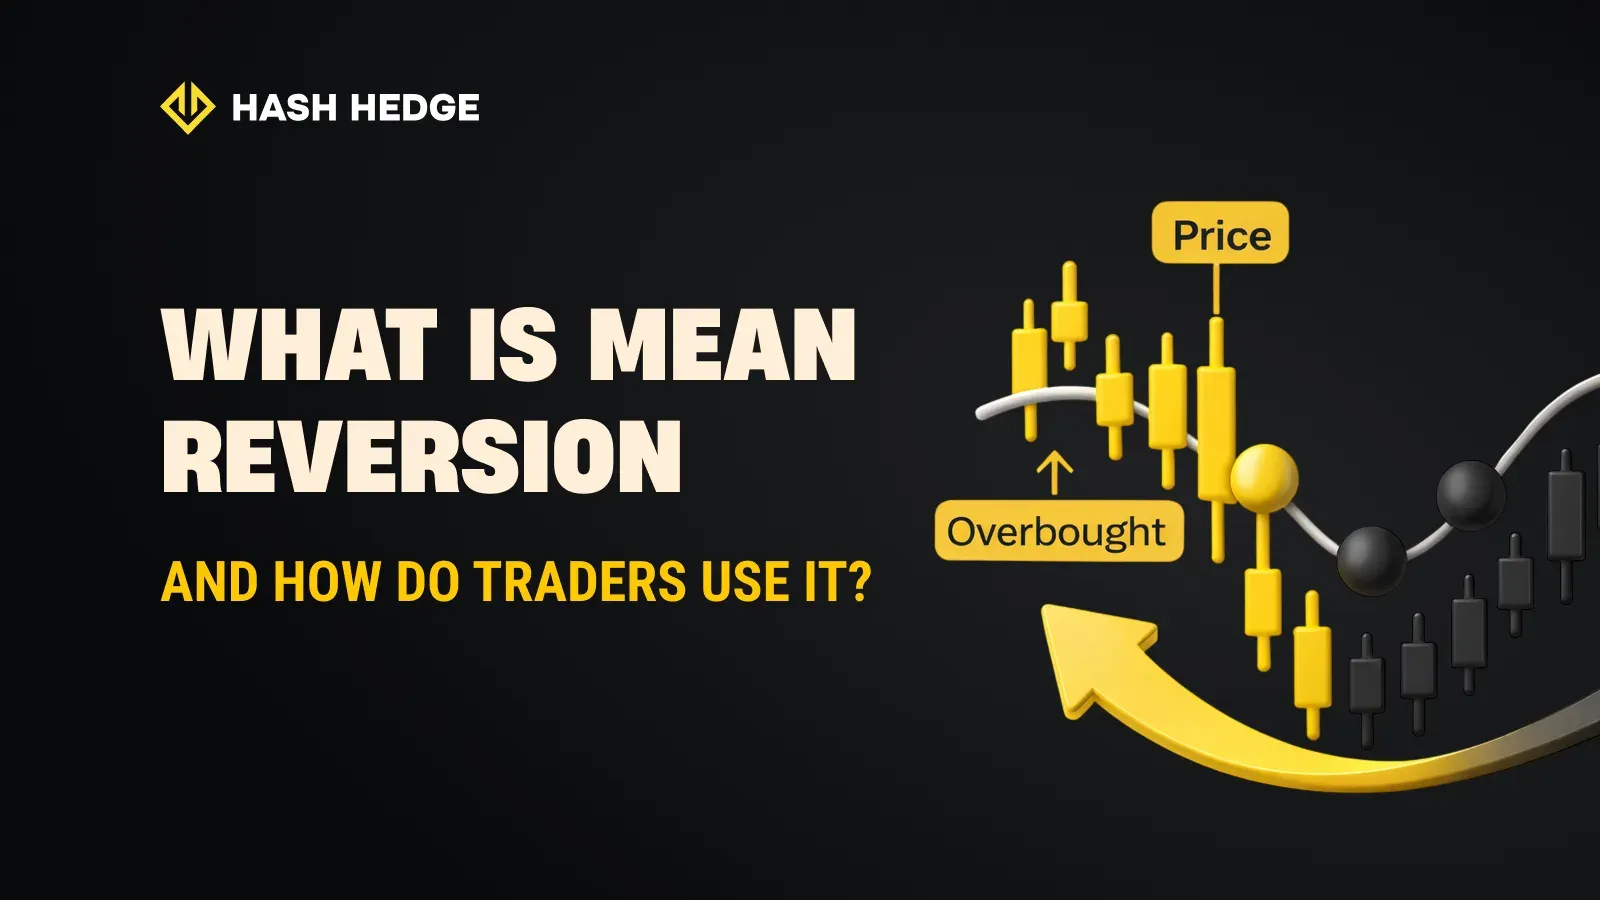
Mean reversion isn’t some rigid formula, it’s more of a behavioral idea. Every asset has a “comfort zone,” a range where it spends most of its time. If you want the academic version: price tends to fluctuate around a statistical average.
What counts as this “average”?
- Moving averages like MA20, MA50.
- A fair-value zone visible during long periods of consolidation.
- Levels where the asset historically hangs around.
- A post-breakout equilibrium after sharp moves.
In other words, mean reversion isn’t strict math; it’s a practical lens traders use to understand when the market might have stretched too far.
When Does Mean Reversion Actually Work?
If we’re honest, the list is short. Mean reversion performs best when the market isn’t in a hurry.
Good conditions include:
- A calm, sideways market, the classic environment for a price mean reversion strategy.
- Steady liquidity.
- Moderate volatility.
- No wild fundamental catalysts.
- Repeated bounces from the same levels.
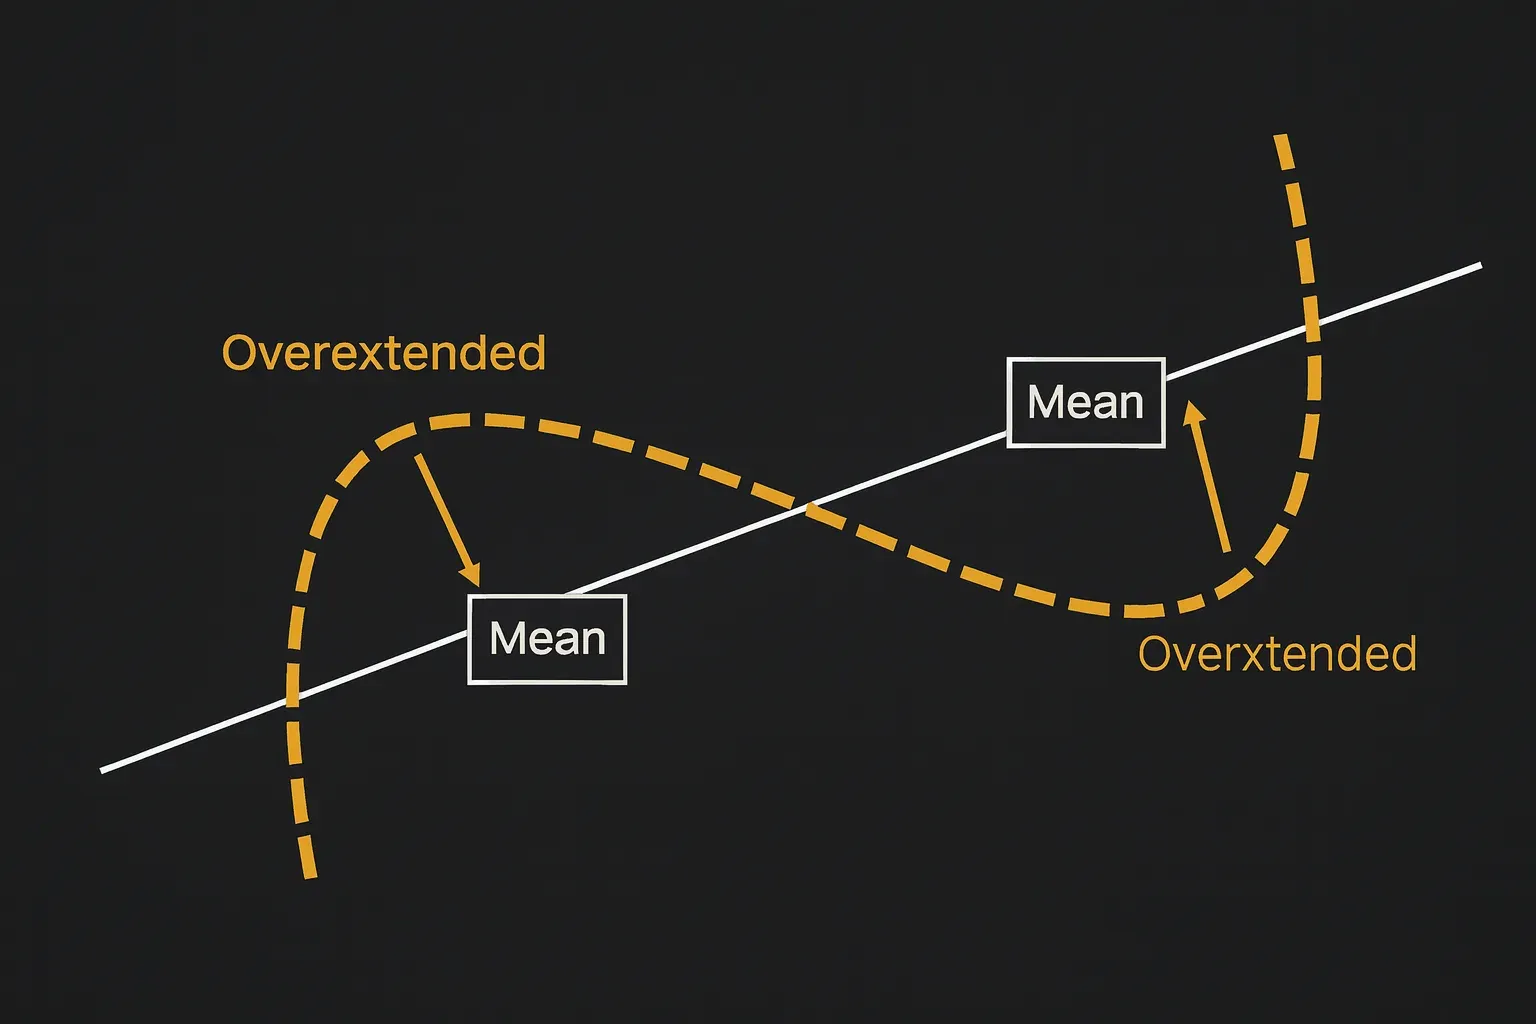
On the chart, it looks something like this: the price shoots upward, stirs some excitement, then gradually falls back to its usual range. Traders love this type of structure because it feels predictable though that’s only half the story.
When Mean Reversion Breaks Down
No trading approach works everywhere, and mean reversion is no exception. Sometimes waiting for a return to the average is practically a guaranteed mistake.
Problematic scenarios:
- A strong trend is forming and doesn’t plan on slowing down.
- News overload sends the market into chaos.
- Panic selling or forced liquidations take over.
- Large players shift the balance.
- Fundamentals have changed so much that the old “average” simply doesn’t exist anymore.
That’s when a trader buys “because it’s too low,” fully convinced the price will bounce… and the market calmly slices through another level downward. Mean reversion quietly morphs into mean destruction.
How Traders Actually Use Mean Reversion
- Moving averages as a guide. Probably the most popular method. If the price stretches too far from MA20 or MA50, many traders treat it as a possible setup for reversion. Not a guaranteed signal but a reason to pay attention.
- Trading off key levels. If an asset consistently returns to the same range, that range becomes a magnet. When price wanders too far away, traders watch for a move back toward the area the market already “respects.”
- Overbought and oversold indicators. RSI, Stochastics, CCI — essentially market thermometers showing when an asset overheats. The logic is simple: overbought → possible pullback, oversold → possible bounce back toward the average.
- Statistical arbitrage. This is the more academic cousin of mean reversion. When two correlated assets suddenly diverge too far, traders look for an entry expecting the spread to snap back to normal. A classic tool for hedge funds and quant desks.

Want to trade smarter? With Hash Hedge, you get a professional terminal featuring 170+ crypto pairs (from BTC to PEPE) and 5x leverage — built to help you turn even sideways markets into profit opportunities.
Common Mistakes When Using Mean Reversion
- Ignoring the trend.
- Blind averaging down.
- Missing the bigger context.
So, Should You Use Mean Reversion?
Sure, as long as you treat it as an analytical tool, not a magic button. It’s a way to spot when the market overextends, when emotions push price too far, or when a temporary imbalance creates opportunity.
Sometimes, mean reversion behaves almost textbook-perfect. Other times it acts like a trickster — winks and runs the other way.
But it has one undeniable advantage: it encourages you to look at the market calmly, notice patterns, and recognize when deviations are simply too big to ignore.