Why Traders Constantly Confuse These Three Concepts
Your stop-loss gets hit, and only then does the market move exactly in the direction you expected. Sound familiar? Was it a false breakout, a liquidity sweep, or a stop hunt?
All three terms describe a similar price event: the market breaks beyond a key level, triggers clustered stop-loss orders, and then reverses. The difference lies in how you interpret the move.
False breakout is a technical chart pattern. Liquidity sweep is a Smart Money interpretation where large participants intentionally target liquidity pools. Stop hunt focuses on who caused the move and whether it was intentional.
Understanding these differences changes more than your chart analysis. It changes where you place your stop-loss and when you enter a trade.
What Is a False Breakout?
A false breakout occurs when price moves beyond an important support or resistance level but fails to stay there before reversing back into the previous range. Traders who entered on the breakout get trapped. Stop-losses placed beyond the level are triggered.
The key characteristic: price moves beyond the level but cannot hold above or below it. The following candle — or several candles — closes back inside the previous range. The longer price remains outside the level, the less likely the move is to be considered a false breakout.
One important point: a false breakout doesn’t necessarily imply market manipulation. Sometimes price simply fails to find enough buyers or sellers to continue. It’s a structural event — not necessarily an intentional one.
False breakouts on BTC/USDT often happen during lower-liquidity periods, such as the Asian or London session. Price briefly breaks below a level, attracts sellers, and then quickly reverses back above it. For many traders, this looks like a signal to go short — but the market quickly invalidates that scenario. This is what is known as a bear trap.
What Is a Liquidity Sweep?
If a false breakout describes what happened, a liquidity sweep explains why it may have happened. According to the Smart Money Concept (SMC/ICT), institutional traders intentionally move price toward areas where stop-loss orders accumulate. Those stop orders provide the liquidity needed to execute large positions efficiently.
Where liquidity pools form:
-
Equal Highs and Equal Lows
When price tests the same level multiple times, breakout traders cluster their orders around those highs or lows. Large players often sweep these levels before reversing the market.
-
Above Resistance and Below Support
Traditional stop-loss placement creates obvious liquidity. Stops clustered above resistance or below support become attractive targets for institutional accumulation.
-
Swing Highs and Swing Lows
Well-defined swing points are among the most common liquidity zones. The more obvious the level, the more liquidity it typically contains — and the more likely it is to get swept.
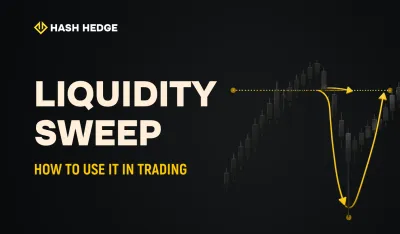
During a liquidity sweep, price quickly spikes beyond the level, returns within 1–3 candles, and continues strongly in the opposite direction — often on above-average volume. During a standard false breakout, price may spend longer beyond the level, volume often decreases after the breakout, and the reversal develops more gradually.
On BTC/USDT, liquidity sweeps often appear as sharp wicks beyond support or resistance followed by an aggressive recovery. Whether intentional or not, the structure repeats regularly.
Stop Hunting: Manipulation or Market Structure?
Stop hunting comes with two popular interpretations. Version one: large institutions, exchanges, market makers, or funds intentionally drive price toward clusters of stop-loss orders. Version two: price naturally moves toward areas with the highest liquidity — because that’s simply how markets function.
In cryptocurrency markets, both explanations may be valid. Crypto remains less regulated than traditional financial markets. Patterns resembling stop hunts regularly appear on BTC/USDT and ETH/USDT. From a trading perspective, the explanation matters less than the outcome. Price repeatedly moves toward obvious liquidity before reversing — and that’s the pattern traders can exploit.
Common stop hunt patterns:
-
Spike Before Trend Reversal
Near the end of a downtrend, price briefly pushes below the previous low. Long positions are stopped out. Then the market immediately rallies. On BTC/USDT, this pattern often forms late Sunday night or during the early Asian session on Monday.
-
Double Bottom with a False Breakdown
Price forms a classic double bottom. Before reversing, it briefly trades below the first low. Retail stops are triggered. Then price rallies above both lows — leaving traders who used the obvious stop placement on the wrong side.
-
Range Stop Hunt
Inside a consolidation, price repeatedly sweeps both sides of the range. Traders using tight stops lose positions in both directions before the actual breakout begins.
Comparing the Three Concepts
Three patterns, one table — trigger, intent, main participants, and trading approach.
| Feature | False Breakout | Liquidity Sweep | Stop Hunt |
|---|---|---|---|
| Trigger | Breakout fails — not enough buyers or sellers to continue | Intentional move toward clustered stop-loss zones | Move toward obvious levels with high stop concentration |
| Intent | No intent — market simply lost continuation | Intentional: institutions fill positions at favorable prices | Intentional or structural |
| Main Participants | Overall market dynamics | Smart Money, institutions, market makers | Large participants or market mechanics |
| Trading Approach | Wait for price to return inside the range, enter with confirmation | Wait for confirmation after the sweep, enter on reversal candle | Place stops beyond obvious levels, enter after reversal signal |
How to Trade These Patterns
The biggest mistake is entering while price is still beyond the level. Wait for confirmation instead:
-
Price sweeps the level
The sweep has occurred — price briefly moved beyond an important support or resistance level.
-
Candle closes back inside the range
On BTC/USDT 1-hour charts, waiting for two or three confirming candles after the return often improves trade quality. Ideally, the recovery candle shows above-average volume.
-
The following candle confirms the reversal direction
This is the structural signal: you’re trading evidence on the chart, not a hypothesis.
Why risk management matters even more here: liquidity sweeps often produce excellent entries, but they occur in highly volatile conditions. After a sweep, price may retest the level before continuing. Risk management remains essential. A common guideline: risk no more than 1% of account equity per trade. Place the stop beyond the sweep extreme — if price revisits that point, the original trade idea is no longer valid.
Using The Strat for confirmation: The Strat classifies every candle relative to the previous one. After a liquidity sweep, wait for a candle that breaks the previous candle’s high (or low) in the direction of the anticipated trend. This creates an objective structural confirmation instead of relying on subjective chart reading.
Why Liquidity Sweeps Matter Even More on Funded Accounts
On a personal account, getting stopped out is frustrating but manageable — you can simply re-enter. On a funded account, every unnecessary stop-out consumes part of your daily drawdown limit. Discipline becomes more than good practice. It becomes necessary for keeping the account alive.
-
Don’t Place Stops Directly Behind Levels
The most obvious stop placement is exactly where liquidity sweeps occur. Instead, place stops beyond the expected sweep area — not directly behind the level itself.
-
Enter Only After Confirmation
Waiting for confirmation means giving up a small portion of the move. In exchange, you significantly improve your probability of success on each trade.
-
Reduce Position Size After Losses
If you’ve already taken losses during the day, reduce your next position size accordingly. Hash Hedge’s two-step challenge allows a 5% daily drawdown. That limit should never become a target — approaching it with several losing trades means operating in a critical zone.
-
Pause After Getting Stopped Out
After a liquidity sweep triggers your stop, wait at least 15–30 minutes before taking another trade. Most emotional decisions happen immediately after a stop-loss.
Key takeaways:
- False breakouts, liquidity sweeps, and stop hunts describe the same market behavior from different perspectives. A false breakout is a chart event. A liquidity sweep is a Smart Money interpretation. A stop hunt focuses on market intent.
- Liquidity consistently gathers around predictable areas: equal highs and lows, support and resistance levels, and well-defined swing highs and lows.
- The best entries come after confirmation — not during the sweep. Wait for price to reclaim the level before entering.
- On a funded account, entry discipline is no longer optional. Every unnecessary stop-out reduces your available daily drawdown buffer.