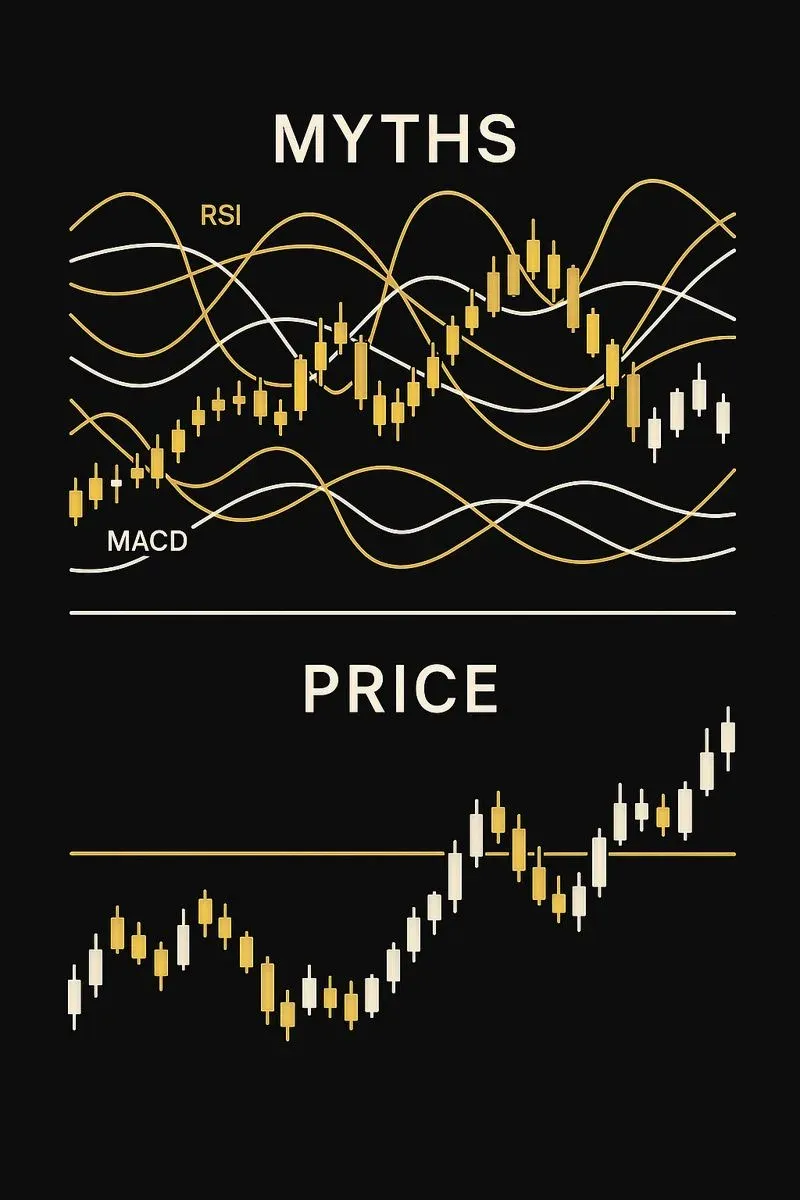
Myth #1: Indicators Predict the Market
This is probably the most persistent myth in trading.
RSI, MACD, Stochastic, Bollinger Bands — the classic toolkit that introduces many traders to indicators in trading. They’re often treated like crystal balls: if a signal appears, price has to react.
It doesn’t.
Every indicator is the processed price. Formulas, smoothing, averages. They don’t look forward; they summarize what has already happened.
Imagine driving a car while staring only at the rearview mirror. You have information, just not the kind you want when moving fast.
The real problem is that even experienced traders start waiting for confirmation. Price moves first, but the entry gets delayed until the indicator “agrees.” The result is worse entries, wider stops, and broken risk-to-reward. One of the most common trading mistakes out there.
Myth #2: More Indicators Mean Better Signals
This myth sounds logical. That’s why it survives.
One indicator feels weak. Two feel safer. Three almost feel convincing. In reality, it works the other way around. Most popular indicators measure the same things: momentum, averages, overbought or oversold conditions. They aren’t independent. They just lag together.
Stack enough of them, and you get an illusion of control. What you actually get is late entries and the constant feeling that the market is always one step ahead.
That’s why many traders eventually ask a different question: how to trade without indicators, and shift their focus toward price action trading, the raw logic of price movement itself, rather than secondary calculations.
Myth #3: Support and Resistance Are Exact Lines
Many traders start learning technical analysis with levels and immediately make the same mistake. They draw them as perfect lines. But support and resistance aren’t coordinates. They’re zones. Areas of interest where market participants might step in.
Price can:
- Stop short of a level.
- Break through it.
- Hover inside the zone.
- Return later.

All of that is normal market behavior.
When traders wait for perfect touches, they either miss trades entirely or get caught in false breakouts, blaming manipulation. More often than not, the market is simply ignoring our expectations.
Myth #4: Chart Patterns Work on Their Own
Head and shoulders, double tops, triangles, flags — chart patterns are taught as if spotting the shape is enough, as if the pattern itself creates the move.
It doesn’t. A pattern is a visual summary of the same crowd behavior that shapes every other setup: where stops cluster, where breakouts get tested, where liquidity sits. The shape doesn’t cause the move; it describes conditions that may or may not resolve the way the textbook suggests.
Traders who trade the pattern alone, without checking volume, market structure, or context, tend to learn this the hard way. A textbook-perfect pattern can fail completely, while a messy one can play out exactly as expected. What matters isn’t how clean the pattern looks on the chart, it’s whether the underlying structure actually supports the move.
Myth #5: Technical Analysis Removes Emotion
This might be the most damaging myth of all.
Many traders enter the market hoping that charts and rules will eliminate emotion. Cold logic. Clean entries. Calm execution.
Reality disagrees.
Technical analysis doesn’t remove emotion — it exposes it. This is where trading psychology takes center stage: fear, FOMO, revenge trading, the urge to prove you’re right.
Most critical trading mistakes aren’t caused by bad analysis, but by emotional reactions to outcomes.
What Technical Analysis Really Is
Strip away the myths, and the picture gets simpler and more honest.
Technical analysis isn’t about predicting the market. It’s about working with probabilities.
It helps traders:
- Structure chaos.
- Identify clear risk points.
- Make decisions consistently.
This becomes especially obvious in crypto trading, where volatility quickly punishes illusions and overconfidence.
Final Thoughts
Technical analysis doesn’t tell the future. It never did. What it really offers is context is a way to understand where price has been and why it might behave a certain way next.
Once traders stop chasing perfect signals and start reading the market as a system of probabilities, decision-making becomes calmer. Less reactive. Less emotional. The chart stops feeling hostile and starts feeling readable.
That’s usually the turning point.
Risk becomes something you manage, not something you fear and trading shifts from constant prediction to structured decision-making.
That’s where consistency begins.