What RSI Shows
RSI in trading measures the strength and speed of price changes. The indicator moves between 0 and 100 and shows how actively market participants are buying or selling an asset. Essentially, the RSI indicator reflects the balance between bullish momentum and selling pressure, allowing traders to evaluate the current market momentum.
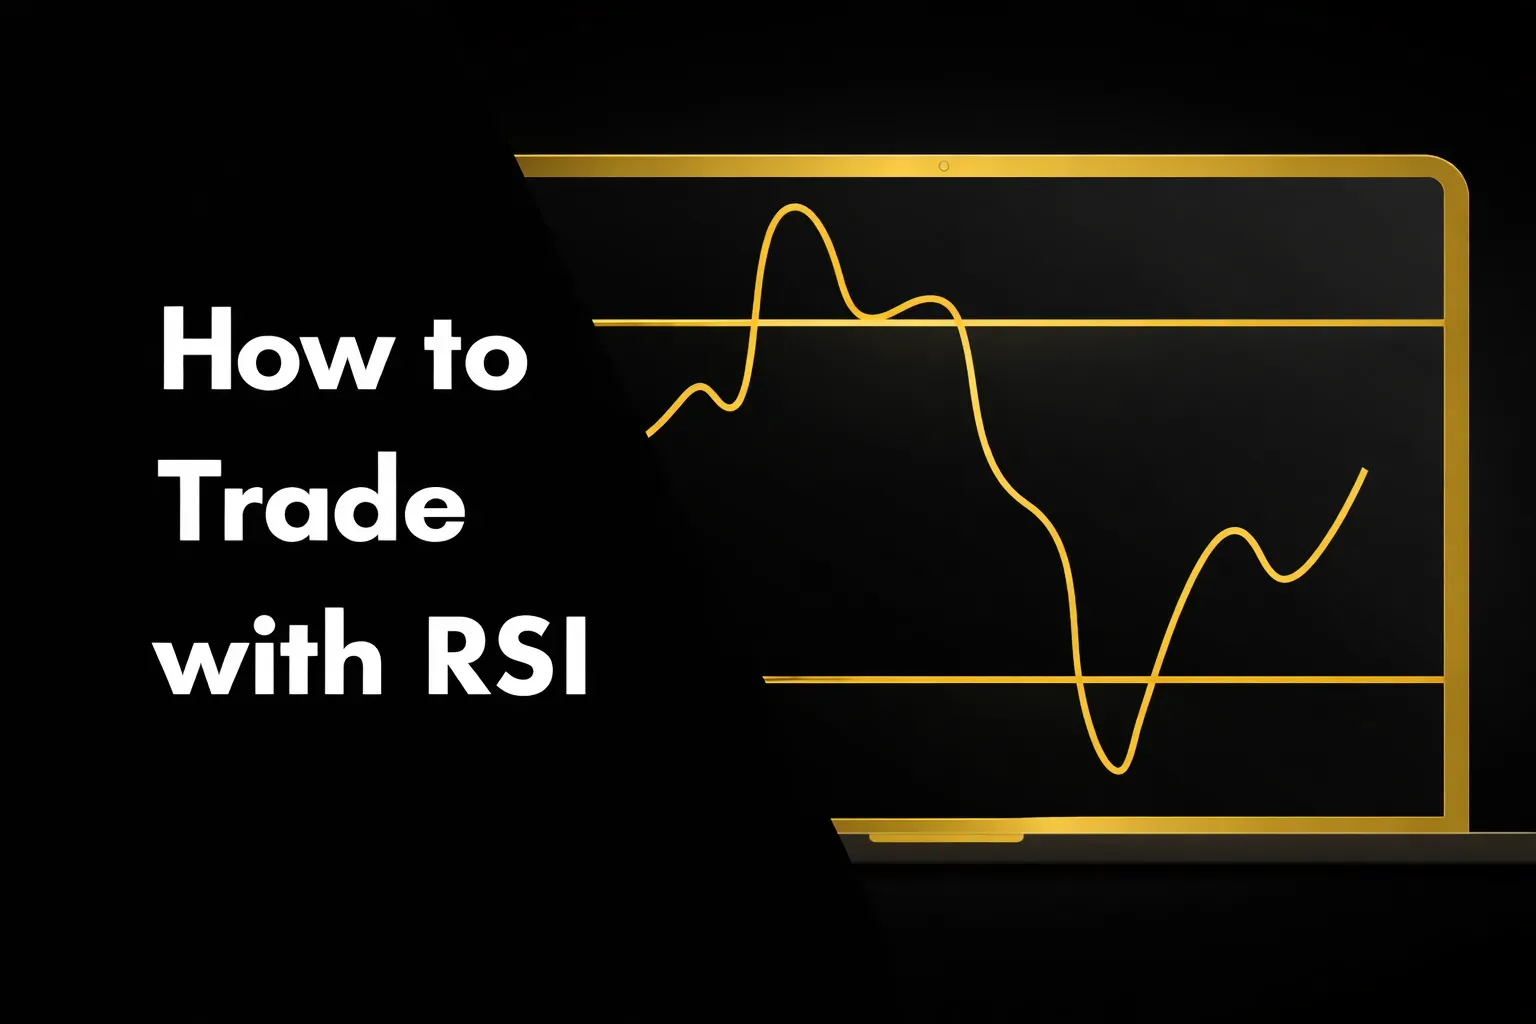
When the RSI value rises above 70, the market is considered overbought. This does not necessarily mean an immediate reversal, but it suggests that the current impulse may be approaching exhaustion. Values below 30 indicate oversold conditions and a potential opportunity for price recovery.
It is important to understand that RSI in trading works best when considered within the broader market structure. In a strong trend, the indicator may remain in overbought or oversold territory for an extended period. In such situations, RSI is more useful for evaluating the strength of the move and identifying moments when the impulse begins to weaken.
Many traders use an RSI signal as the basis for decision-making. However, without additional confirmation, these signals can appear too frequently, especially in the highly volatile cryptocurrency market. That is why RSI for trade entry is typically used together with other tools of cryptocurrency technical analysis, such as volume analysis in cryptocurrency or market structure.
Why Volume Is Important for Signal Confirmation
Volume analysis in cryptocurrency helps determine how actively market participants support the current move. When an indicator signal coincides with increased trading activity, the probability of continuation becomes higher.
Key factors to pay attention to include:
- Price movement without an increase in trading volume often indicates a weak impulse that may quickly fade.
- When an RSI signal for trade entry coincides with rising market activity, the likelihood of continuation increases.
- Confirmation through RSI and volume shows that the move is supported by real market participation.
- Growth in trading volume after RSI exits the oversold zone may signal the start of a new impulse.
- If volume remains low, the RSI signal may only represent a short-term price reaction.
RSI Divergence
One useful signal is RSI divergence. It occurs when price makes a new high or low while the RSI indicator fails to confirm the move.
Combined with trading volume analysis, such a signal may indicate weakening momentum. If price continues rising but volume gradually declines, it often suggests decreasing buyer activity.
In these situations, traders closely monitor changes in market momentum, since divergence can precede a reversal or a deeper correction.
Using RSI and Volume in a Range
The combination of RSI and volume in trading is especially useful in range trading, when the market does not form a clear trend and moves between support and resistance levels. In such situations, price repeatedly returns to the boundaries of the range, and the trader’s task is to identify potential reversal points within the channel.
When the market moves inside a range, the RSI indicator helps identify moments when price approaches extreme levels and the impulse begins to weaken. RSI values in the overbought zone near the upper boundary of the range may indicate buyer exhaustion, especially if trading volume is also declining.
In these conditions, a range trading strategy is typically built around finding entries near the range boundaries. If RSI signals overbought conditions near the upper channel boundary while volume gradually decreases, this may indicate slowing momentum and a potential pullback into the range.
The same logic applies near the lower boundary. When price approaches support and RSI in trading shows oversold conditions, an increase in volume analysis in cryptocurrency may indicate renewed buyer interest. In such cases, a potential trade entry point appears, since the movement begins to gain support from real market activity.
How to Filter Signals
Even when using multiple tools, it is important to consider the broader market context. An RSI signal should not be evaluated in isolation from price structure, liquidity levels, and the overall trend.
The combination of RSI and volume helps reduce the number of false entries, but the final decision should always consider the risk–reward ratio and the acceptable risk per trade. Even a strong signal does not guarantee success if the risk exceeds acceptable limits.
Risk management in trading remains the foundation of consistent performance. Volume confirmation increases the probability of a successful trade, but proper risk control remains the key element of any strategy.
Importance for Prop Trading
In crypto prop trading, it is especially important to work with confirmed signals and avoid random entries. Using RSI in trading together with trading volume analysis helps improve decision accuracy and reduce the number of weak trades.
Within the Hash Hedge trading challenge, stability and discipline matter more than aggressive trading. Traders who confirm signals and maintain strong risk control in trading are more likely to pass the evaluation and obtain a funded trading account.
When trading with company capital, the main objective is not maximizing profit in a single trade but maintaining consistent performance and following strict risk management rules.
Final Thoughts
The combination of RSI and volume in trading improves analysis quality and helps identify more reliable trade entry points. The RSI indicator shows the condition of the market, while volume analysis in cryptocurrency reveals whether the move is supported by real participants.
Using these tools together helps filter signals more effectively, evaluate market momentum, and trade only in situations where the probability of continuation is higher.
When preparing for the Hash Hedge trading challenge and working with capital up to $100,000, the key skills remain discipline, market analysis, and systematic risk management in trading.