What Are Flat and Sideways Markets
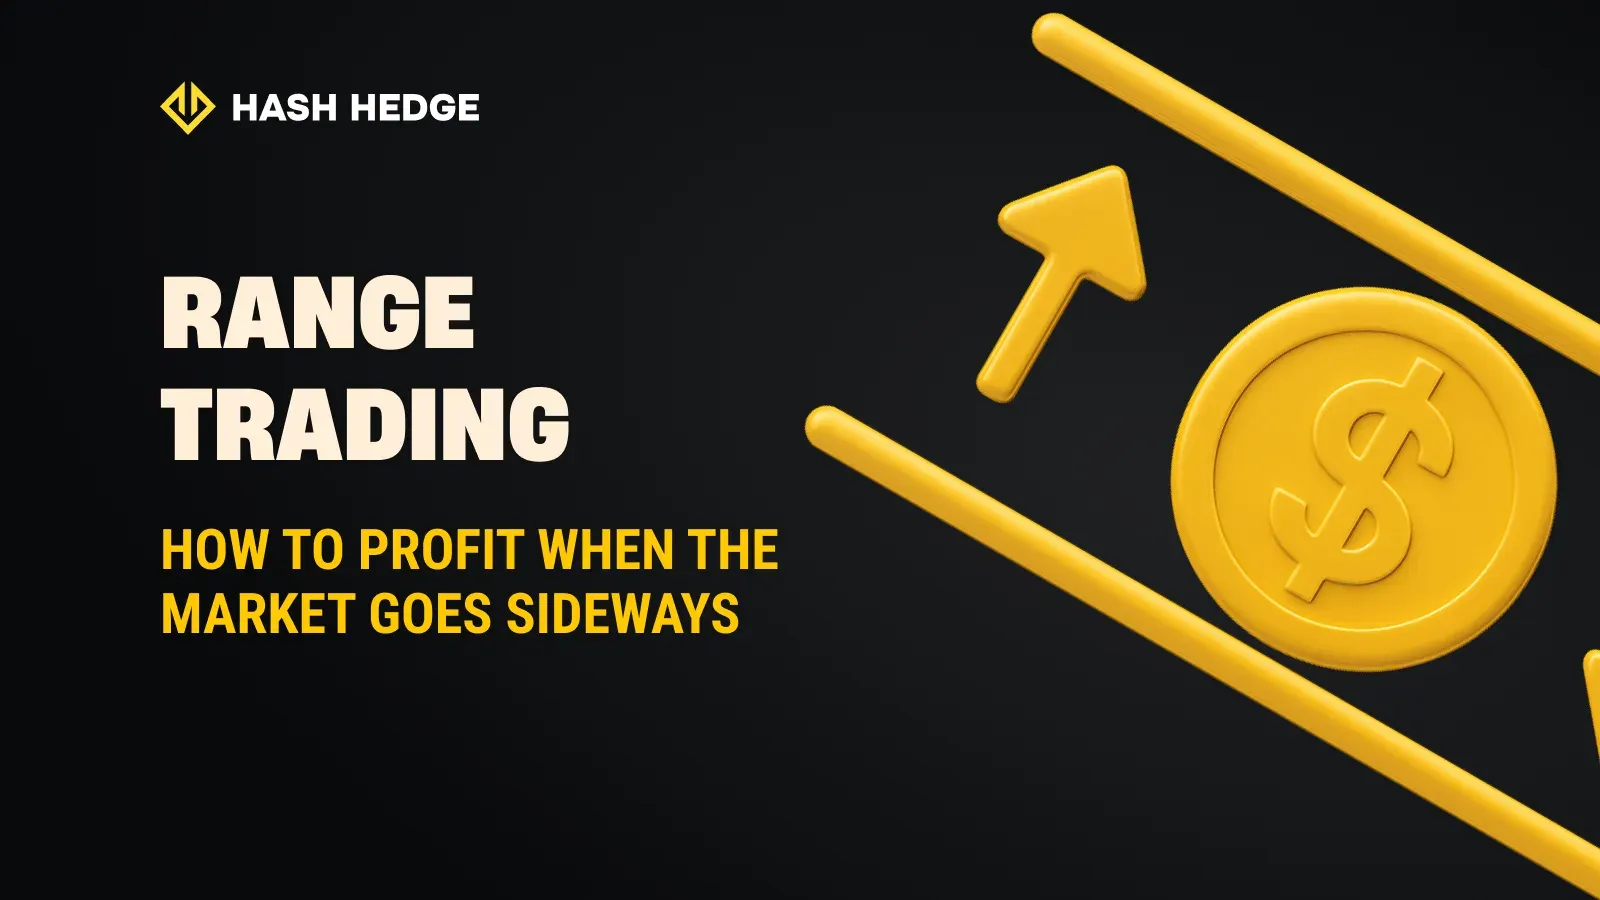
A flat or sideways market is when prices move within a narrow range over a period of time. It’s that quiet stretch on the chart where momentum disappears, volatility drops, and buyers and sellers seem evenly matched. You’ll see price bouncing between clear support and resistance levels, like a pendulum with no real direction.
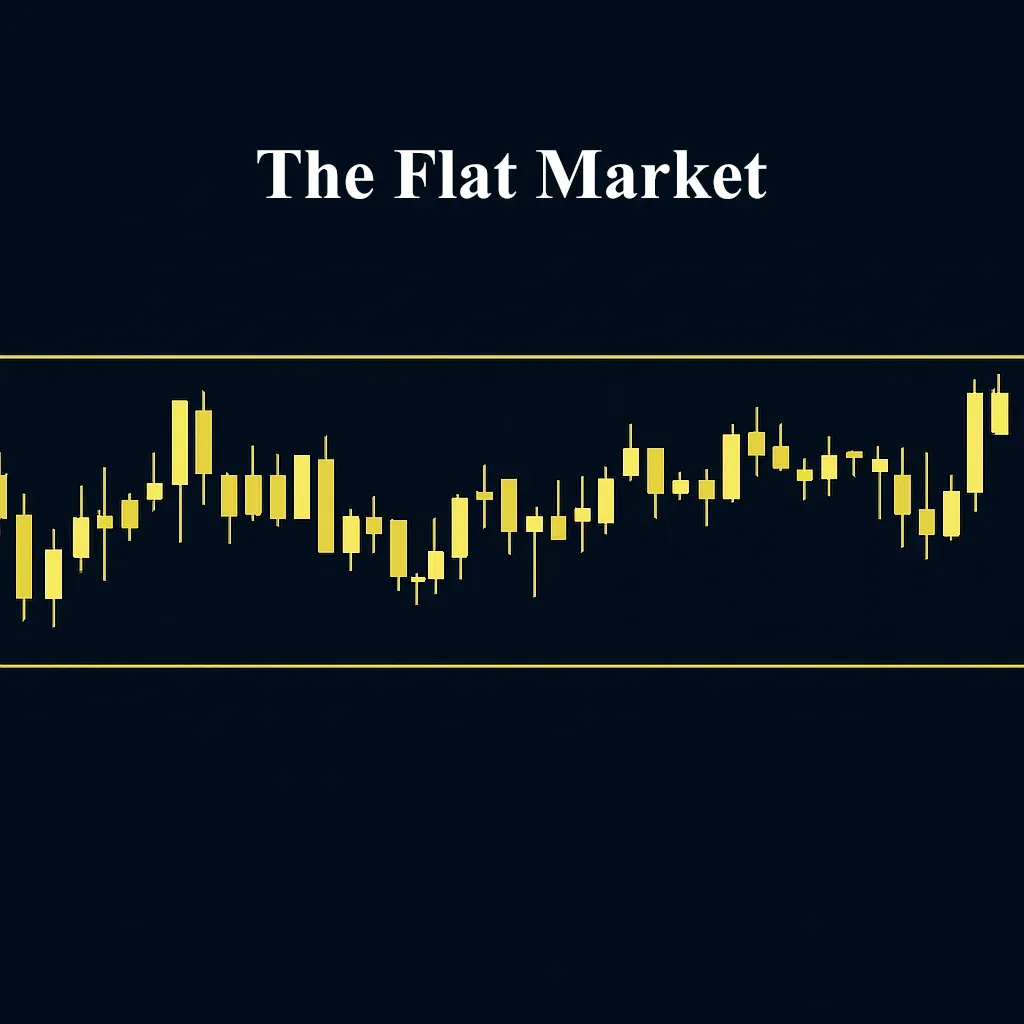
Traders often describe it as the market not trending, just waiting for a reason to move. And while it might look uneventful at first glance, understanding how to read and trade these calm phases can reveal some of the most consistent opportunities in any market.
So let’s talk about that: how to make consistent money when the market goes sideways.
What Exactly Is Range Trading?
Range trading is one of the simplest and most surprisingly effective ways to trade. The idea is pretty straightforward:
- Identify key support (the lower boundary where buyers step in).
- Identify key resistance (the upper boundary where sellers show up).
So the main idea: buy low, sell high. Repeat.
Why Ranges Matter
Here’s something many traders overlook: markets range most of the time. According to our data, financial assets spend nearly 70–80% of their time moving sideways. That means if you’re only chasing trends, you’re sitting on the sidelines for most of the action. Range traders don’t wait for perfect setups. They thrive in boredom — that slow, choppy price action that frustrates breakout traders. They profit from indecision.

And that’s exactly where the right tools make a difference. Want to try range trading without taking unnecessary risks? With Hash Hedge, you get a professional terminal featuring 160+ crypto pairs (from BTC to PEPE) and 5x leverage to turn even sideways markets into profit opportunities.
The Psychology of Sideways Markets
Let’s talk about the mental side. Range trading is disciplined work — it’s about consistency. Around 75% of all price action in major assets like BTC, ETH, and NASDAQ occurs inside defined ranges. Yet, according to behavioral trading studies, over 68% of traders lose money in these conditions because they lack patience. They either overtrade or jump in too early, trying to “predict” the breakout instead of respecting the boundaries.
So the hardest part here is not getting FOMO. The moment you start believing the range is about to break, the market will remind you who’s boss.
“The range ends only when everyone stops believing it will.”
How to Spot a Range
You need technical skills. Not every flat-looking chart is a true range.
Look for:
- At least two clear touches on both support and resistance.
- Low volatility between those levels.
- Declining volume often signals a lack of strong conviction.
Some traders draw horizontal lines; others prefer to use tools like Bollinger Bands (the price oscillates between upper and lower bands) or RSI (values bouncing between overbought and oversold).
You can even confirm with moving averages — when the 50 and 200 MAs flatten and intertwine, it’s a strong sign the market’s caught in a range.
The Classic Range Strategy
Here’s the bread and butter of range trading:
- Buy near support — when price shows rejection (like a pin bar or bullish engulfing pattern).
- Sell near resistance — when price stalls or reverses with a bearish signal.
- Set a tight stop-loss just below support or above resistance.
If you’re feeling fancy, you can add confirmation from oscillators like RSI or Stochastic to time your entries better.
Managing Risk
The tricky part about range trading is false breakouts. Markets love to fake one direction before reversing hard. It’s how liquidity gets trapped. So, you will face the market makers, who create fakes on the chart.
To protect yourself:
- Use tight stop-losses. If support truly breaks, don’t argue with the market.
- Avoid overleveraging. A range can flip into a breakout in seconds.
- Always wait for confirmation.
A good habit: wait for a retest. If price breaks above resistance, then comes back to test it as support, then you can decide if the range is done.
Tools That Make It Easier
A few tools can help you master sideways markets:
| Tool | Purpose in Range Trading |
|---|---|
| RSI | Identifies overbought and oversold zones, helping spot potential reversals near range boundaries. |
| Bollinger Bands | Visualizes volatility compression — when bands tighten, it often signals a potential breakout or a good bounce opportunity inside the range. |
| Volume Profile | Shows price levels with the highest trading activity, helping confirm where true support and resistance lie within the range. |
| ATR (Average True Range) | Measures market volatility and helps adjust stop-loss size so it fits current conditions instead of random fixed distances. |
If you’re ready to start learning and actually using all those tools — RSI, Bollinger Bands, Volume Profile, ATR, the Hash Hedge Terminal makes it effortless. You can customize your charts, set automated alerts, and analyze more than 160 crypto pairs. And trade them ofc.
The Transition Phase — From Range to Trend
Every trend starts as a breakout from a range. That’s why experienced range traders often become the first to catch new trends — they’re already watching closely.
When you notice:
- Higher highs forming above resistance.
- Increased volume.
- And stronger momentum indicators.
It might be time to switch gears from range to trend mode. In fact, one of the best signals of a new trend is a breakdown of the level.
Putting It All Together
Range trading is about rhythm. Flat markets favor those who appreciate stability. It’s a slow dance between buyers and sellers, where your job is to move in sync — not rush ahead, not lag behind. The opportunities are there, quietly waiting between those levels.