What Is an Order Block?
An order block is commonly defined as the last opposing candle before a strong impulsive price move.
For a bullish order block, this is typically the last bearish candle before a strong move upward. For a bearish order block, it is the last bullish candle before a move downward.
The logic behind the concept is that before a strong move, positions were being accumulated and opposing orders were being absorbed in that area.
That is why, when price returns, traders consider this zone a potential area for another reaction.
It is important not to confuse an order block with ordinary consolidation or an arbitrary support or resistance level.
The key characteristic is the connection between a specific candle or small group of candles and the strong price impulse that follows.
But even that is not enough to consider every such area on the chart a valid order block.
Next, we’ll look at which additional characteristics can help distinguish strong zones from random ones.
How to Find a Valid Order Block on a Chart
The simplest way to identify an order block is to work backward from the impulse to where it began. First, find a strong price move, then identify the last opposing candle before it.
Step 1. Find a Strong Impulse
Start with a pronounced price move: either one large impulse candle or a series of candles that quickly move away from a specific level.
In crypto markets, such moves can occur after news releases, liquidation cascades, or during periods of elevated trading volume.
The impulse is what gives a potential order block its significance. If no strong move followed the candle, the candle itself does not automatically become an order block.
Step 2. Identify the Last Opposing Candle
Once you have identified the impulse, go back to where it began.
For a bullish order block, look for the last bearish candle before a strong move upward. When price returns, this area can be considered a potential support zone.
For a bearish order block, the logic is reversed: look for the last bullish candle before a strong move downward. On a retest, this area may act as a potential resistance zone.
If several candles moving in the same direction formed before the impulse, traders usually focus on the last one immediately preceding the sharp move.
Step 3. Define the Zone Boundaries
Once you have selected the candle, mark the order block on the chart.
Depending on the methodology used, the boundaries may be defined by the high and low of the entire candle or by the boundaries of its body.
The resulting area becomes a zone of interest. If price later returns to it, the trader watches for a reaction and looks for additional confirmation rather than automatically entering a trade on the first touch.
How to Tell a Strong Order Block from a Weak One
Not every last opposing candle before a move is equally significant.
When evaluating an order block, there are several characteristics worth considering.
A strong impulse formed after the zone
The more decisively price moves away from the order block, the more reason there is to consider the area significant. A slow and uncertain move provides a weaker signal.
Price has not completely moved through the order block
If the market has already returned to the zone, moved all the way through it, and closed beyond the opposite boundary, the order block is generally considered invalidated and loses its original significance.
The zone aligns with the higher-timeframe context
An isolated order block on a lower timeframe provides less context than a zone that aligns with the structure of a higher timeframe.
For example, a 1-hour order block inside a 4-hour zone and aligned with the daily trend provides multiple confirmations for the same scenario.
That is why the presence of an order block alone is not an entry signal. What matters more is where it formed, how strong the subsequent impulse was, and what is happening with market structure on higher timeframes.
Order Blocks and Fair Value Gaps: How Are They Connected?
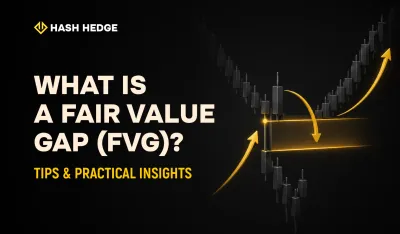
Order blocks and Fair Value Gaps (FVG) often form as part of the same impulsive move. That makes it useful to analyze them together rather than as separate elements.
When price moves sharply away from an order block, the rapid move may leave an FVG behind. In a bullish scenario, this zone is usually located above the order block; in a bearish scenario, below it.
As a result, a pullback can create two potential reaction zones. Price may first test the FVG. If there is no reaction there and the pullback continues, the order block becomes the next area of interest.
For example, in a bullish scenario, a trader may wait for price to return to the FVG above the order block. If price reacts there, the FVG becomes a potential area for looking for an entry. If price moves deeper, attention shifts to the order block itself. In this scenario, the Stop Loss can be placed below its low, where the original trade idea becomes invalid.
The combination of an FVG and an order block also affects position sizing.
When entering from the FVG, the distance to the Stop Loss below the order block is greater, so with a fixed amount of risk, the position size should be smaller.
With a deeper entry directly from the order block, the Stop Loss distance becomes shorter. With the same dollar risk, this allows for a larger position size.
Order Blocks and Liquidity Grabs: How the Setup Works
Another Smart Money setup combines a liquidity grab, impulsive displacement, and an order block retest.
The sequence works like this:
- Price takes liquidity beyond a significant level, such as equal lows, a local low, or the previous session’s low.
- After the liquidity grab, price sharply moves in the opposite direction.
- A new order block forms at the beginning of this impulse. In a bullish scenario, this is the last bearish candle before the move upward.
- Price then pulls back to the newly formed order block.
- If a reaction is confirmed during the retest, the area can be considered a potential entry zone in the direction of the impulse.
The strength of this setup comes from combining several elements.
The liquidity grab shows where the market swept stops beyond a significant level, the impulse confirms a change in short-term direction, and the order block provides a specific area for looking for an entry and placing a Stop Loss.
However, the order block retest itself does not guarantee that the move will continue. Market structure, the higher timeframe, and price action within the zone should also be taken into account.
When Does an Order Block Become Invalid?
An order block is considered invalid when price moves through the zone and closes beyond its opposite boundary.
After that, the previous block should no longer be used as potential support or resistance.
For a bullish order block, invalidation occurs when a candle closes below the low of the zone. This means buyers failed to hold the level and the original scenario is no longer valid.
For a bearish order block, the opposite logic applies: the zone loses its relevance after a candle closes above its high.
Simply touching the zone does not invalidate an order block. Price can move into the block, leave a wick, and reverse. As long as price has not closed beyond the opposite boundary, the zone can still be considered in the analysis.
The practical rule is simple: if price completely breaks through the order block and closes beyond it, it is better to remove the zone from the chart.
Old, invalidated blocks can clutter the chart and create false reference points for future trades.
Order Blocks in the Context of Market Structure
An order block should not be evaluated in isolation, but together with the overall market structure. The same block can have a different significance depending on whether its direction aligns with the higher-timeframe trend.
- In a bullish structure, the market forms higher highs and higher lows. In this context, bullish order blocks below the current price take priority. During a correction, they become potential support zones from which traders can look for continuation of the upward move.
- In a bearish structure, the market forms lower highs and lower lows. Here, more attention is given to bearish order blocks above the current price. During an upward pullback, these areas can be considered potential resistance zones from which traders can look for continuation of the downward move.
What to Do If an Order Block Goes Against the Market Structure
If the direction of an order block contradicts the higher-timeframe structure, the setup requires greater caution.
For example, a bearish order block within a clearly bullish structure implies a trade against the primary move. In this case, it may be worth looking for additional confirmation, reducing risk, or skipping the entry altogether.
The clearest scenario occurs when the order block and the higher-timeframe structure point in the same direction. In that case, the zone becomes part of an established market context rather than an isolated signal against it.
How to Use Order Blocks on a Funded Account
For trading on a Funded Account, an order block is useful because it provides a clearly defined entry zone and a level at which the trade idea becomes invalid.
This helps determine several trade parameters in advance:
- An entry can be considered within a predefined zone.
- The Stop Loss can be structurally placed, for example, below the low of a bullish order block.
- The distance to the Stop Loss can be determined before opening the position and then used to calculate position size.
Instead of placing an arbitrary Stop Loss at a fixed distance from the entry, the trader has a specific level beyond which the original trade idea is no longer valid.
This is especially important when calculating position size. First, determine a logical location for the Stop Loss, then calculate the position size based on that level and the predefined amount of risk.
If the order block is wide — for example, if it covers more than 2% of the price move — increasing risk or artificially tightening the Stop Loss is not a good solution. Instead, a trader can wait for a deeper entry into the zone or reduce the position size so that even with a wider Stop Loss, the predefined risk per trade remains unchanged.
Key Takeaways
- An order block forms before a strong impulse. It is the last opposing candle before a pronounced price move, not just any consolidation zone on the chart.
- The direction of the impulse determines the type of order block. A bullish order block is typically the last bearish candle before a move upward, while a bearish order block is typically the last bullish candle before a move downward.
- A strong impulse confirms the significance of the zone. If price does not make a pronounced move after a potential order block, the candle should not automatically be considered significant.
- Once broken, the zone loses its relevance. If price moves through an order block and closes beyond its opposite boundary, the block is considered invalid and is best removed from the chart.
- Order blocks work best alongside other confirmations. FVGs, liquidity grabs, and higher-timeframe structure can help filter potential zones and provide context for a trade.
- On a Funded Account, an order block helps define risk in advance. The boundaries of the zone provide a structural reference point for the Stop Loss, after which position size can be calculated based on the predefined risk per trade.