Why Price Moves Toward Liquidity
Large participants cannot open significant positions at a single price without moving the market. They need volume, which appears when large numbers of stop orders and liquidations are triggered. That is why price often moves toward areas where the highest concentration of orders is located.
Liquidity forms in predictable places: local highs and lows, range boundaries, support and resistance levels, and round price levels. The more obvious the level, the more traders place their stop-loss orders beyond it, making the area more attractive for a liquidity grab.
Within Smart Money Concepts, these zones are viewed not as reversal points but as targets for price movement. The market often collects liquidity first and only then forms a directional move.
The Mechanics of False Breakouts and Stop Hunting
Retail traders tend to follow the same behavior pattern: entering on a level breakout and placing a stop on the opposite side. As a result, a large cluster of orders forms beyond key extremes.
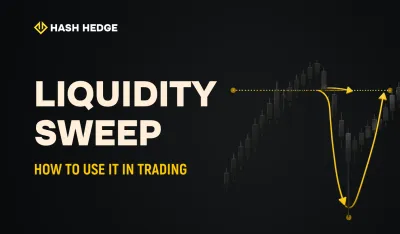
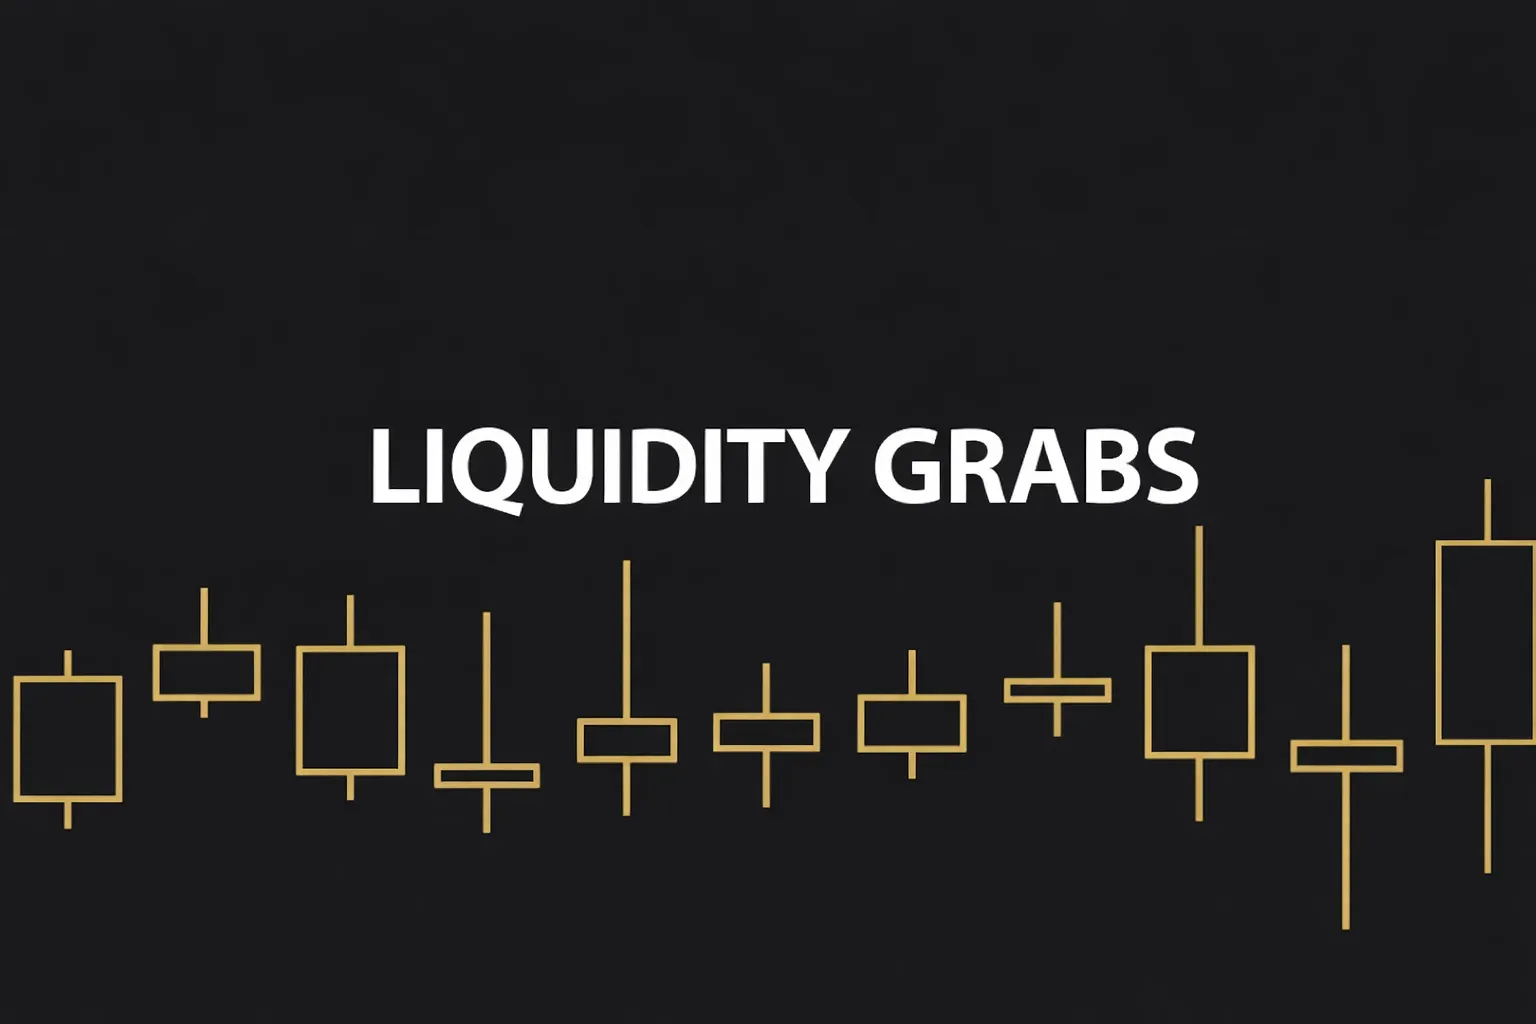
When price reaches such a level, the market often pushes through it, triggers stops and breakout entries, gains the required volume, and then reverses. After returning inside the range, the move in the opposite direction accelerates as positions opened on impulse are forced to close.
This is how market traps are formed. They create the illusion of a new trend, while in reality the move may only be a stage of liquidity collection before a reversal.
Where Liquidity Grabs Occur
The strongest reactions usually occur in areas where the market has been consolidating for a long time. Within such ranges, stops from both buyers and sellers gradually accumulate. A move beyond the range boundary often appears as a breakout but frequently represents a liquidity sweep.
Special attention should be paid to higher-timeframe extremes. Highs and lows of previous days, weeks, or months often become key targets. Increased liquidity in trading also forms near areas where sharp reversals or strong impulsive moves previously occurred.
Understanding these areas helps anticipate potential price targets and avoid entries in high-risk zones.
How to Distinguish a Real Breakout from a Liquidity Grab
| Indicator | Real Breakout | Liquidity Grab (False Breakout) |
|---|---|---|
| Holding above/below the level | Price holds above/below the level and forms a new structure | Price quickly returns back into the range |
| Speed of movement | Gradual development of the move, continuation appears | Sharp impulse followed by a fast return inside the range |
| Post-break behavior | New highs/lows form, the market accepts the level | No continuation, the level is not sustained |
| Structure of the move | Consolidation after the breakout followed by trend development | Impulse without consolidation and loss of direction |
| Liquidity context | The move originates from an accumulation zone | The move occurs beyond obvious levels where stops are clustered |
| Entry risk | More favorable risk–reward ratio | High probability of stop hunting and repeated stop-outs |
The key signal of a false move is a fast return into the range. The quicker price comes back after breaking a level, the higher the probability that a liquidity grab occurred rather than the start of a new trend.
This type of analysis helps avoid entries in high-risk conditions and reduces the likelihood of getting caught in market traps.
Typical Mistakes When Working With Liquidity
Most losses related to liquidity come not from the strategy itself but from misinterpreting price action and poor risk management in trading. The most common mistakes include:
- Entering a breakout without structural confirmation, when the move turns into a false breakout after a liquidity grab.
- Opening positions during volatility expansion, which increases risk per trade and worsens the risk–reward ratio.
- Placing stop-loss orders in obvious locations (beyond local highs or lows), where stop hunting is most likely.
- Trying to quickly recover losses after a stop is triggered and re-entering without a new trading scenario.
- Increasing position size after a series of losses, leading to higher overall risk control issues.
- Emotional trading and reacting to price movement instead of following a predefined market structure.
- Ignoring higher timeframes and key liquidity zones, where stop hunting occurs most often.
Such actions lead to trading in conditions of high uncertainty and often result in losing streaks. Consistent risk control in trading, understanding market structure, and waiting for confirmation help reduce mistakes and improve performance stability.
Importance for Prop Trading
In crypto prop trading, understanding liquidity zones is especially important. Frequent breakout entries and trading inside market traps increase the probability of consecutive losses and may lead to drawdown limit violations.
A trader funding program is built around consistency and risk control. Traders who account for liquidity in trading, act selectively, and avoid aggressive entries are more likely to pass the evaluation and receive a funded trading account.
When trading with company capital, the priority is not maximizing profit in a single trade but preserving the account and maintaining consistent results.
Final Thoughts
Liquidity grabs and stop hunting are natural parts of market mechanics. Price moves toward areas where volume is concentrated, and obvious levels often act as targets rather than entry points.
Understanding how liquidity sweeps work, trading only after structural confirmation, and maintaining strict risk management in trading help reduce losing trades and improve consistency. In the long run, success depends less on entry precision and more on the ability to adapt to real market behavior.
When preparing for a trading challenge at Hash Hedge and working with capital up to $100,000, the key factors are understanding liquidity structure, maintaining disciplined risk control, and acting consistently rather than trading frequently.