What Is the Fair Value Gap?
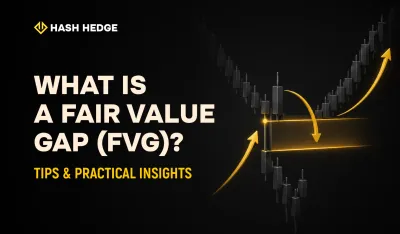
Fair Value Gap (FVG) is trader jargon for a spot on the chart where the market didn’t trade “fairly”. It’s like when a bus zooms past a stop without picking anyone up: you can see the space where something should’ve happened.
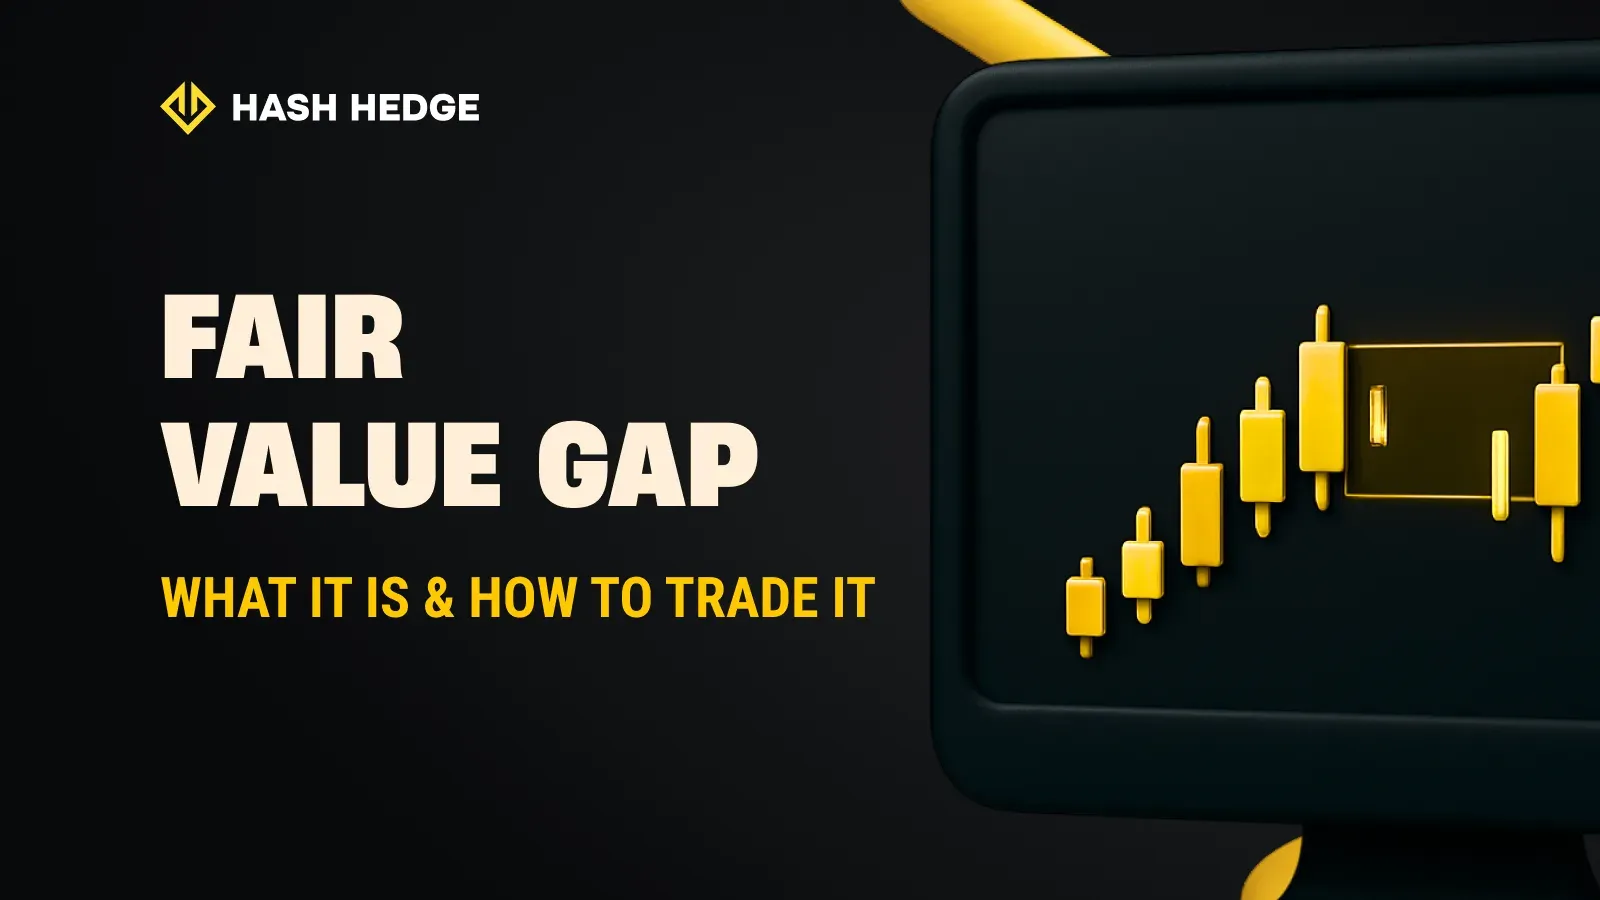
Technically, it shows up as a three-candle pattern:
- Candle one starts the move.
- Candle two pushes hard in one direction.
- Candle three doesn’t overlap candle one’s wick.
That little “no man’s land” between them is your Fair Value Gap. And no, it’s not the same as a weekend gap or a news spike gap. This is more subtle, an inefficiency inside continuous price action.
Long Story Short
The market moved so quickly that it left unfilled orders behind.
Stop risking your funds. Start trading with Hash Hedge.
Why Do Fair Value Gaps Happen?
The market doesn’t like inefficiency. But sometimes it can’t help itself. Here are the two main culprits:
- Breaking news or surprise events. Think CPI data, Fed rate decisions, or even a big hack. One side of the market floods in with orders. The other side can’t keep up. Price skips over levels instead of trading through them.
- Big institutional orders. Banks & funds don’t play small. When they unload a massive position, it chews through liquidity. Price surges, gaps open, and suddenly you see those “empty” spots on the chart.
So, retail traders often chase the move, but pros are waiting for the price to circle back and fill the gap.
How Traders Use FVGs
The main reason traders watch FVGs is because they can highlight areas for entries or exits. The most common play is betting on price revisiting the gap. Picture it like gravity: markets tend to come back and “fill” inefficiencies before continuing.
Here’s a typical flow:
- Spot the FVG after a strong move.
- Wait for the price to retrace into that gap.
- Enter in the direction of the original move — bullish FVG? Look for longs. Bearish FVG? Look for shorts.
- Place stops just outside the gap.
Simple on paper, yes. But the context matters. Not every gap gets filled, and not every fill leads to a bounce.
Stop-loss placement is another key aspect of trading these setups. For bullish trades, stops are often placed just below the gap. For bearish setups, just above. If price moves beyond a major swing high or low before touching the gap, that’s usually a sign the setup has failed.
Benefits and Limits
The value of FVGs is that they show you where the market moved too quickly. They give you reference zones that can be used to plan cleaner trades. So they appear on every timeframe, from daily charts down to minutes, which makes them flexible.
But they’re not perfect. Not every gap gets filled, and sometimes they stay open for months. That’s why context matters. Using them alone is risky, but combining them with structure and confluence can give you an edge.
Common Mistakes
One of the first traps new traders fall into is thinking every gap is a trade. They see an imbalance on the chart and jump right in. Another mistake is treating FVGs like magic reversal points. Fair value gaps on their own don’t mean the price will suddenly flip direction. They work best when used with the overall market flow, not against it.
The other big pitfall is risk management — or rather, the lack of it. Too many beginners place trades without a stop loss, assuming the market will eventually “come back” to their level. Sometimes it does, but when it doesn’t, the result can be a blown account.
The idea behind FVG
Markets are constantly searching for equilibrium between buyers and sellers, and when the price moves too fast, that balance gets disrupted. An FVG is basically a footprint of that imbalance. It tells you, “Hey, there weren’t enough orders here, so price might want to revisit this level later.”
Think of it like skipping a step while running upstairs, so you can keep going, but sooner or later, you feel the need to come back and reset your rhythm. That’s why traders watch FVGs closely: they act like magnets for price, pulling it back to restore order before the next move.
How to find a Bullish FVG
A bullish fair value gap shows up when the market pushes upward so quickly that buyers leave no time for sellers to fill orders in between. On the chart, look for three candles: the first and third should have no overlap with the middle one’s body. In a bullish case, the low of the third candle will sit above the high of the first. That empty space between is your bullish FVG.
How to find a Bearish FVG
A bearish FVG is the mirror image. It forms when sellers take control and drive the price down in a sharp move. Again, you’ll see a three-candle pattern, but this time the high of the third candle is lower than the low of the first one. The “gap” between them highlights unfinished business on the chart — an area where price may retrace before sellers step back in. Traders often mark these zones as potential short entries.