
What Is a Breakout Strategy in Trading?
At its core, a breakout strategy in trading is simple: when an asset pushes beyond a well-watched support/resistance level with strong volume, it signals a shift. If price breaks above resistance, traders often look for long positions. The idea is to catch the market as it starts trending in a new direction, instead of reacting once the move is already over.
Think of support as a market floor and resistance as a ceiling. Price bounces between them until pressure builds. Eventually, that tension has to be resolved.
Support levels form because buyers see value and step in, while resistance forms where sellers lock in profits. Both levels feed off each other — more traders notice them, more orders pile up, and the stronger these barriers become. When price finally escapes one of these zones, it’s a signal of changing sentiment. That’s why breakout trading is so popular across markets.
How Breakout Trading Really Works
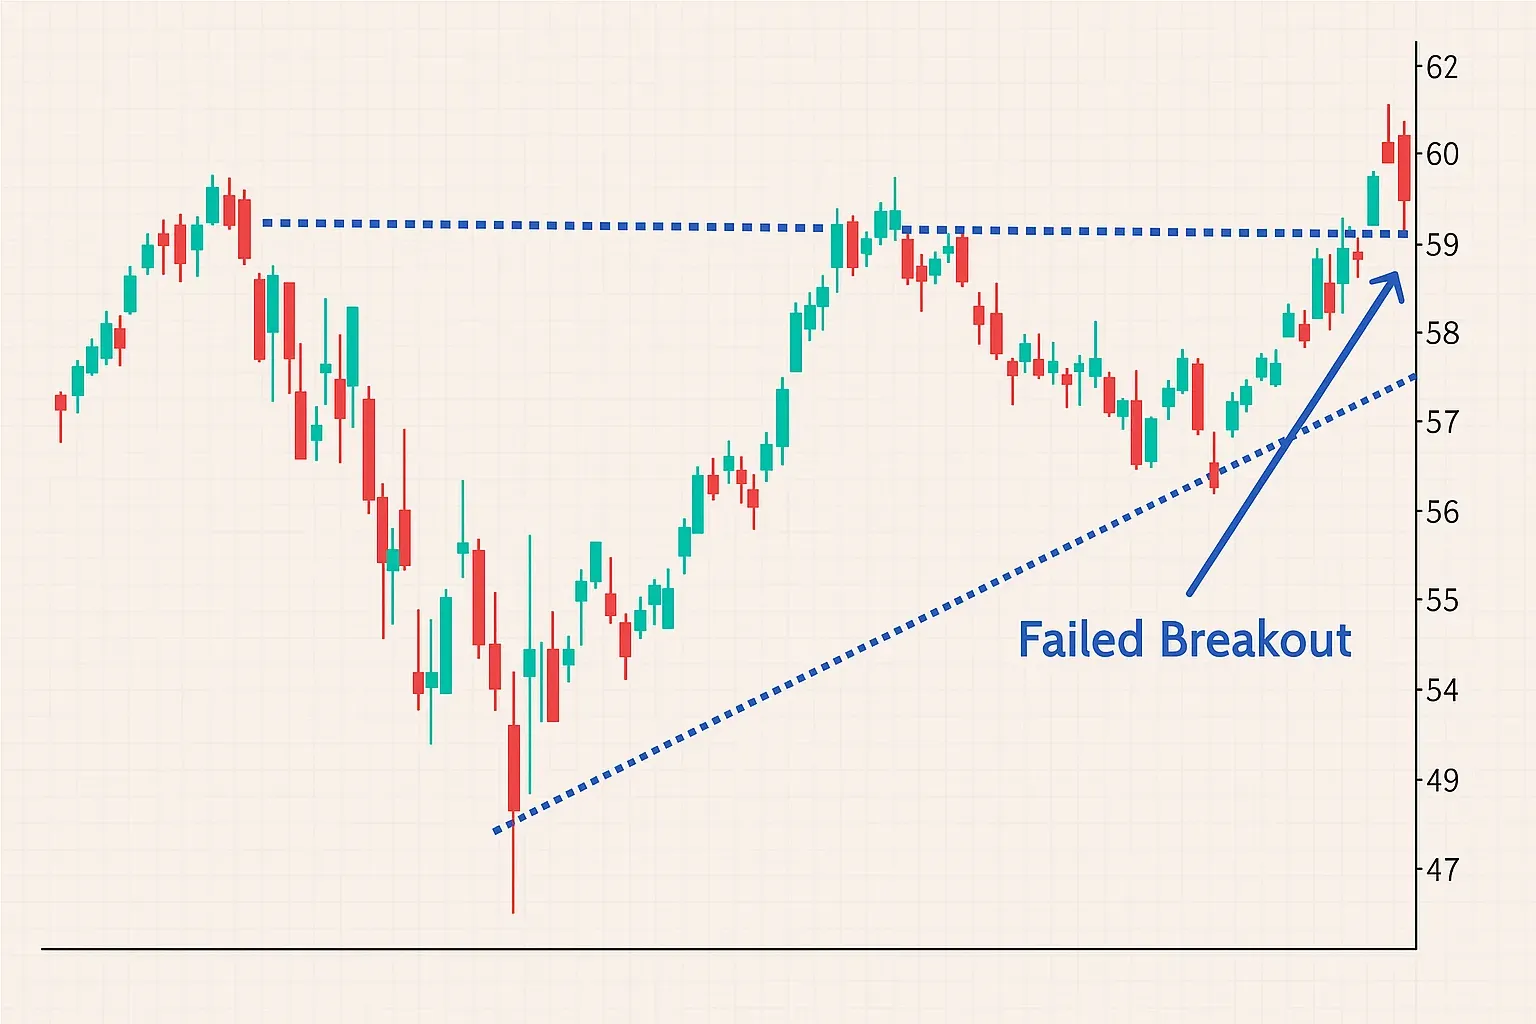
A breakout happens when the market absorbs all buy or sell orders protecting a key level and still has enough momentum to push through. Volume shows that new participants are entering the market, adding strength behind the move. Without it, you’re likely dealing with a false breakout, where price briefly crosses a level but quickly reverses.
When breakouts hold, they often trigger a wave of volatility. Strong directional moves follow as retail traders jump in, algorithms activate on technical signals, and stop-loss orders get triggered. This cascade of activity adds fuel to the move, creating price swings that can exceed initial expectations.
Continuation vs. Reversal Breakouts
Not all breakouts look the same. Some continue the dominant trend: think Bitcoin pushing higher after weeks of consolidation. Others mark a complete shift: a bearish breakout after a long uptrend that signals exhaustion.
Continuation breakouts occur when the market pauses briefly, often forming a consolidation pattern like a triangle or flag. Here, the breakout signals that the trend still has strength, and buyers or sellers are confident enough to push price further in the same direction. Traders often look for high volume at the breakout point and alignment with the broader market context to confirm continuation.
Reversal breakouts happen at the end of a trend, when the price finally breaks through a strong support or resistance that has been holding the market in place. These moves often signal a shift in market sentiment: bulls exhausted after a rally, or bears giving up after a prolonged sell-off.
| Characteristic | Continuation Breakout | Reversal Breakout |
|---|---|---|
| Definition | Breakout in the direction of the current trend | Breakout signaling a trend change |
| Signal | Volume rises with the trend | Volume rises against the previous trend |
| Example | BTC breaks resistance after consolidation | BTC drops below support after a long uptrend |
| Strategy | Follow the trend | Take profits quickly, use tight stops |
The difference between continuation and reversal breakouts lies in context. A continuation breakout can offer lower-risk entries in the direction of the trend, while a reversal breakout opens the door for positioning early in a new trend, but carries a higher risk of failure.
False Breakouts and Trader Psychology
Here’s the painful truth: many breakouts fail. You buy the breakout, only to watch price snap back inside the range. Why does this happen? Sometimes, because of low volume, other times because larger players deliberately run stops before moving the market their way.
Psychology plays a huge role. Fear of missing out (FOMO) makes traders chase the first green candle. But patience pays — waiting for confirmation like a candle close beyond resistance or a retest of the level reduces fakeouts. Breakout trading isn’t about speed alone; it’s about discipline.
How to Trade Breakouts Step by Step
Successful breakout trading strategies share one thing: preparation. You start by identifying key levels of support and resistance long before price tests them. When the price approaches, you’re ready.
The entry can vary: some traders jump in as soon as volume confirms the move, others wait for a retest of the broken level. Stops usually sit just beyond the breakout line, keeping risk tight. Profit targets can be projected using the size of the consolidation zone or trailing stops to capture extended runs.
The details differ, but the principle stays the same: let the market prove before you risk real money.
Tools That Help Spot Market Breakouts
Charts tell the story, but indicators highlight the details. Moving averages can confirm the trend direction; Bollinger tightening can hint at an upcoming breakout; volume indicators reveal whether the move has muscle behind it.
In practice, most breakout traders use charting platforms like TradingView, Hash Hedge, or order flow tools to monitor setups.
The Pros and Cons of Breakout Trading
Breakout trading strategies are popular for a reason. They offer clear entry and exit points, can generate strong momentum-driven profits, and apply across multiple markets. Once your analysis is done, you can even automate parts of it: placing stop-loss and take-profit orders and letting the market play out.
Breakouts move fast, so hesitation costs opportunities. Patience is also required — you might wait days for a setup that never materializes. And of course, false breakouts can eat at both your confidence and your asset if you don’t manage risk carefully. Breakout trading works, but it works best when you accept its limitations and trade with discipline.
Final Thoughts
Breakout trading is about reacting to clear signals with structure and discipline. The principles remain the same: respect support and resistance levels, wait for volume confirmation, and manage your risk.
For the trader navigating a crowded market, having the right tools can make all the difference. Hash Hedge empowers you to analyze 160+ crypto pairs in real time, identify liquidity shifts before they happen, and execute trades without hidden fees.