What Moving Averages Actually Do
Moving averages (MAs) are one of the most widely used indicators in technical analysis, and for good reason. Around 70% of professional traders rely on some form of MA to filter out noise and identify trends.
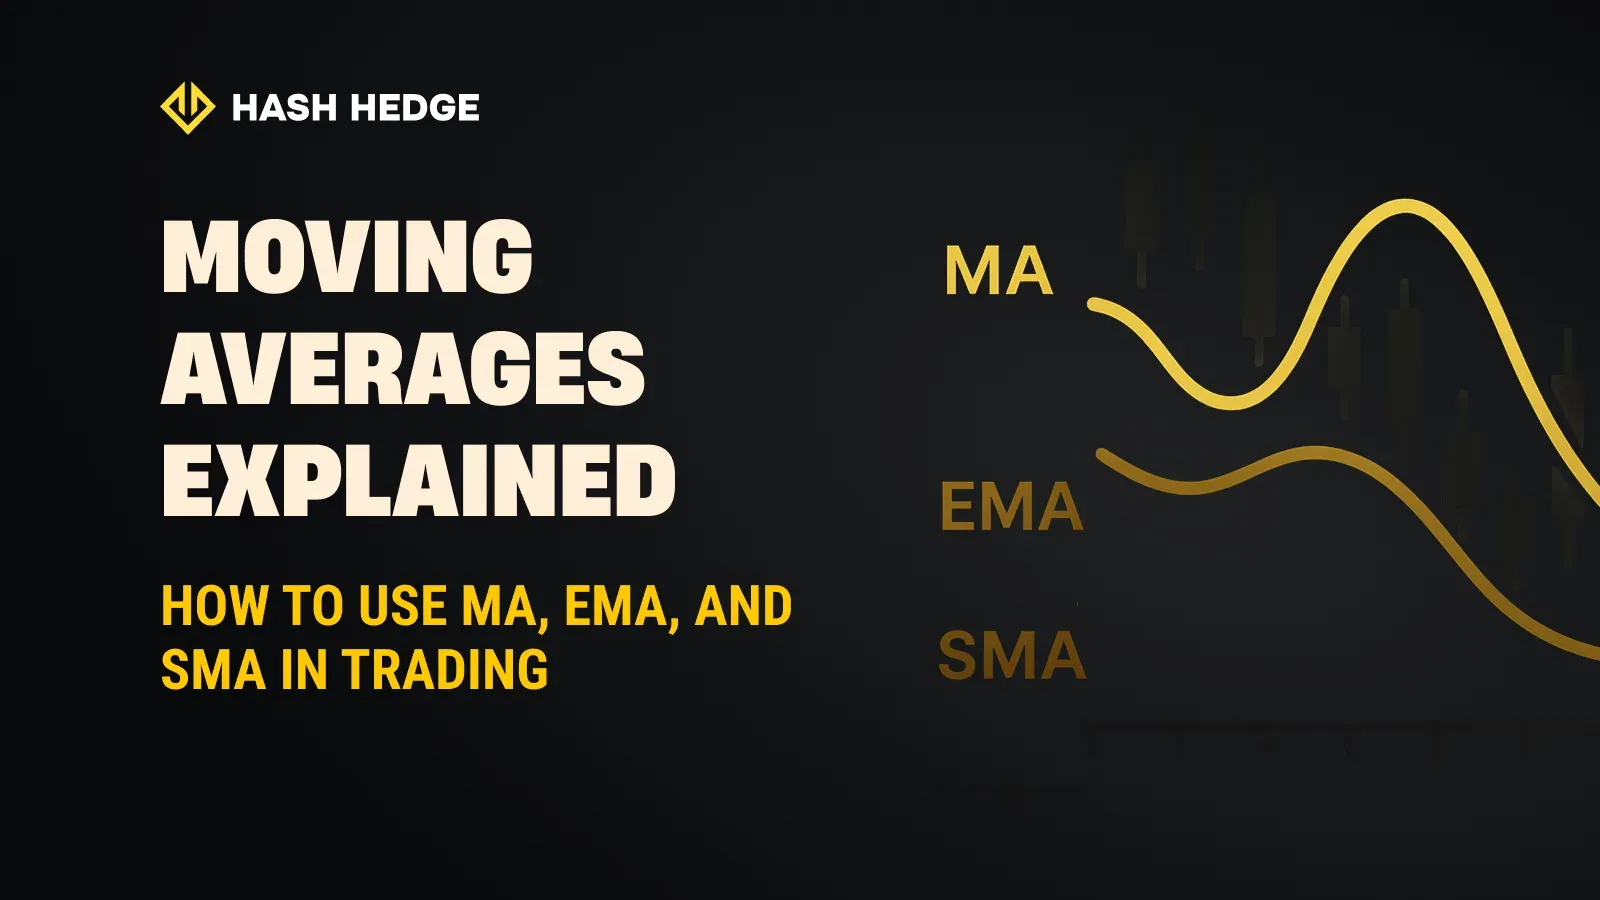
At their core, MAs calculate the average price over a specific period — whether it’s 20, 50, or 200 candles. By doing so, they smooth out short-term volatility and show the market’s true direction. A 50-day MA, for example, captures the medium-term sentiment, while a 200-day MA reflects the long-term trend that many institutions watch closely.
Think of it like this: if raw prices are static on a screen, a moving average turns them into a melody. Instead of reacting to every tick, you start following rhythm, momentum, and intent.
Moving averages don’t predict. They help you see where momentum is building or fading, giving traders a perspective that’s grounded in data.
What Is a Simple Moving Average (SMA)
Let’s start with the classic. The simple moving average (SMA) takes the closing prices over a given period, adds them up, and divides by the number of periods. The result is a smooth, even-tempered line that tells a trustworthy story.
Traders love SMAs because they offer clarity. A 50-day or 200-day SMA, for example, helps identify the general direction.
When price stays above the SMA, it signals a bullish phase. When it breaks below, it’s often a sign of weakening momentum.
The SMA may lag, but it’s still a favorite among swing traders and long-term investors. Want to test these signals in real conditions safely? Hash Hedge gives you a professional terminal with 160+ crypto pairs, from BTC to PEPE, and 5x leverage on every trade.

What Is an Exponential Moving Average (EMA)
In simple terms, an Exponential Moving Average (EMA) is a faster way to check the market. By assigning up to 90% more weight to the most recent data points, the EMA reacts to price shifts almost instantly. That’s why it’s the go-to tool for scalpers, intraday traders, and algorithmic systems, which depend on quick signal confirmation.
Statistically, short EMAs like the 9 or 20 period lines often mark the first stage of a trend reversal — when price crosses above, momentum is strengthening. When it breaks below, weakness is creeping in. But faster signals come with more noise. In highly volatile markets, EMAs can trigger 30–40% more false signals than SMAs.
The key is balance: pair EMAs with filters like RSI (for momentum) or volume confirmation to cut through the noise. Used right, an EMA can act as your market radar — sensitive, fast, and surprisingly accurate when combined with the right data.
Which One Should You Use — MA, SMA, or EMA?
It depends on your personality as much as your strategy. Here’s a good guide, save it for later:
| Indicator | What It Does | Best For | Strengths | Weaknesses |
|---|---|---|---|---|
| MA | A general term for any average of prices over time. | All traders | Simplifies price action and reveals trends. | Too broad, needs context. |
| SMA | Averages all data points equally over a set period. | Swing traders, long-term investors. | Smooths volatility, shows clear long-term trends. | Lags behind price during fast moves. |
| EMA | Weighs recent data more heavily for faster reactions. | Day traders, scalpers, algorithmic systems. | Responds quickly to market shifts, detects momentum early. | It can produce false signals in choppy markets. |
Traders often overthink this. The truth is, no moving average is “better” — they just serve different purposes. What matters is consistency. Pick your tool and learn its rhythm.
How Traders Actually Use Moving Averages
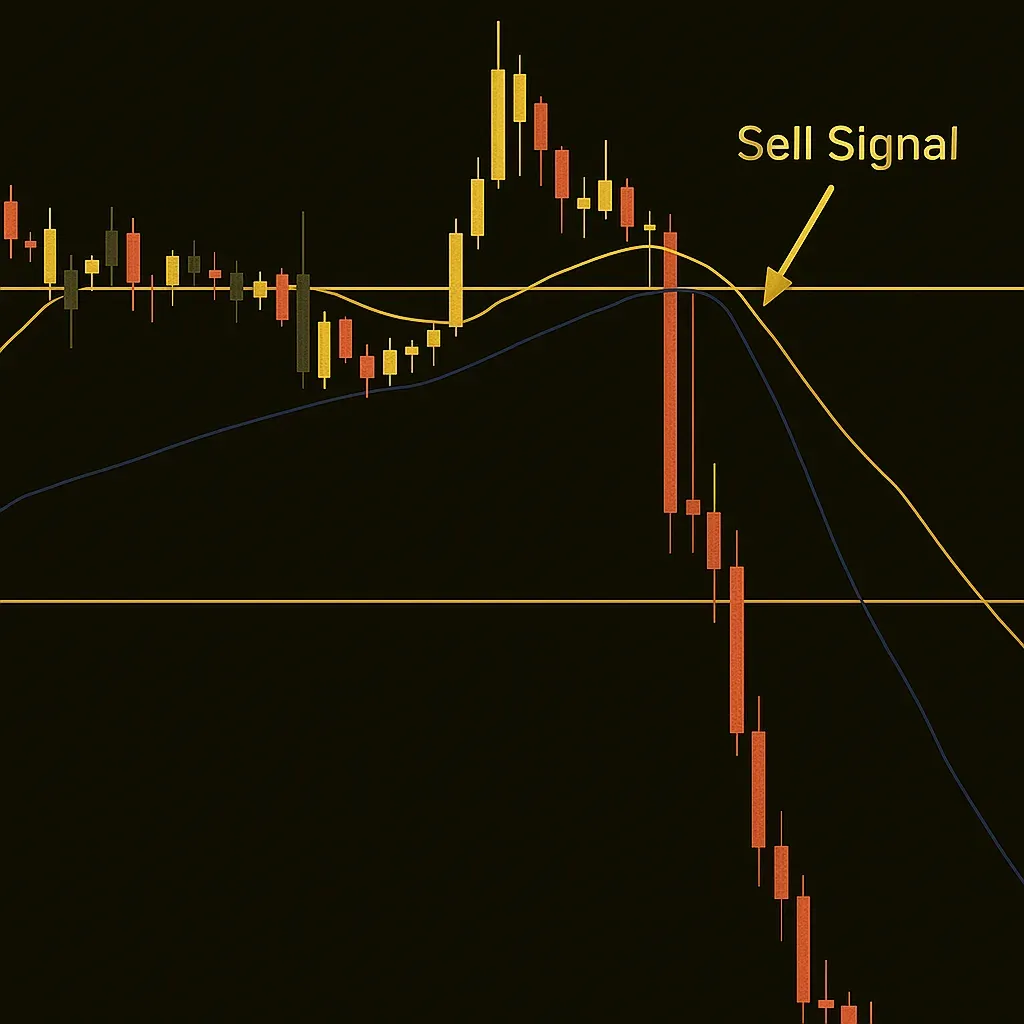
- Golden Cross and Death Cross. Golden Cross (50-day MA crosses above 200-day MA): signals potential long-term uptrend. Historical data shows BTC has gained 35–50% in the months following a clean Golden Cross. Death Cross (50-day MA crosses below 200-day MA): signals potential downtrend. On average, crypto assets drop 20–30% within 3–6 months after this signal, though false signals happen in sideways markets.
- Dynamic Support and Resistance. MAs act as psychological zones. Price often reacts at 20, 50, or 200-day EMAs. Use stop-loss orders slightly below the MA to protect against false breakouts.
- Dual-Average Strategy. Combine a fast MA (10–20 EMA) for entries with a slow MA (50–100 EMA) for trend confirmation. Crossovers: fast crossing above slow and potential buy; fast crossing below slow and potential sell. Divergence: fast MA flattening while slow continues upward, so momentum weakening; consider scaling out of positions.
High volatility means MA-based systems help maintain structured entries and exits even during sudden swings. MAs work best when paired with volume, market structure, and momentum analysis, giving you both timing and context for smarter trades.
Common Mistakes Traders Make with Moving Averages
You’d be surprised how often moving averages are used incorrectly. Here are the big ones:
- Switching timeframes too often. Constantly changing settings breaks your strategy. Pick parameters and stick with them long enough to gather real data.
- Chasing signals. Seeing a crossover doesn’t mean it’s time to act blindly. Look for confluence — more than one reason to believe the trend is real.
- Ignoring market context. An MA in a range-bound market behaves differently than in a trending one. Learn to read the backdrop.
- Overcomplicating setups. Stacking five MAs on a chart doesn’t make it smarter.
The Psychological Edge of Moving Averages
Beyond generating signals, moving averages (MAs) provide a crucial psychological anchor in the volatile crypto markets. They transform market noise into a clear visual of the trend, filtering out the emotional static of every sharp wick and panic candle.
This structure translates into disciplined rules that directly combat FOMO. Using two MAs (e.g., a fast and a slow EMA) adds another layer of objectivity, clearly defining the trend’s direction and your appropriate bias within it.
Final Thoughts
Moving averages are one of those rare tools that combine technical reliability with emotional grounding. They teach patience, discipline, and perspective — qualities every profitable trader eventually learns the hard way. Whether you’re holding long positions or scalping volatility, MAs can be your visual anchor, keeping your strategy consistent when emotions try to knock you off course.